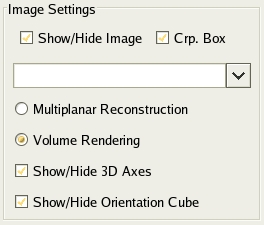
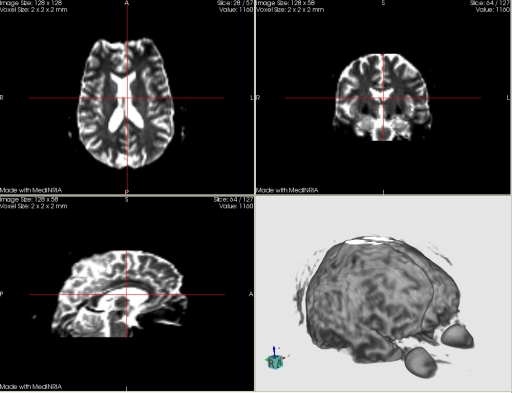
Once your DTI-study has been successfully created, you may want to visualize the DWI you loaded. In the DTI-Module main window (Fig. 3.1) you will see four different screens. The upper-left one corresponds to the 2D axial view of the volume, while the upper-right screen is the coronal view and the lower-left to the sagittal view. The lower-right screen is the 3D view of the volume. You can switch between the different DWI thanks to the selection box situated in the Display panel (Image Settings Fig. 3.5, left).
![]() You can also visualize other images
independently by loading them with the ``open volume'' button.
You can also visualize other images
independently by loading them with the ``open volume'' button.


|