

The remodeling model
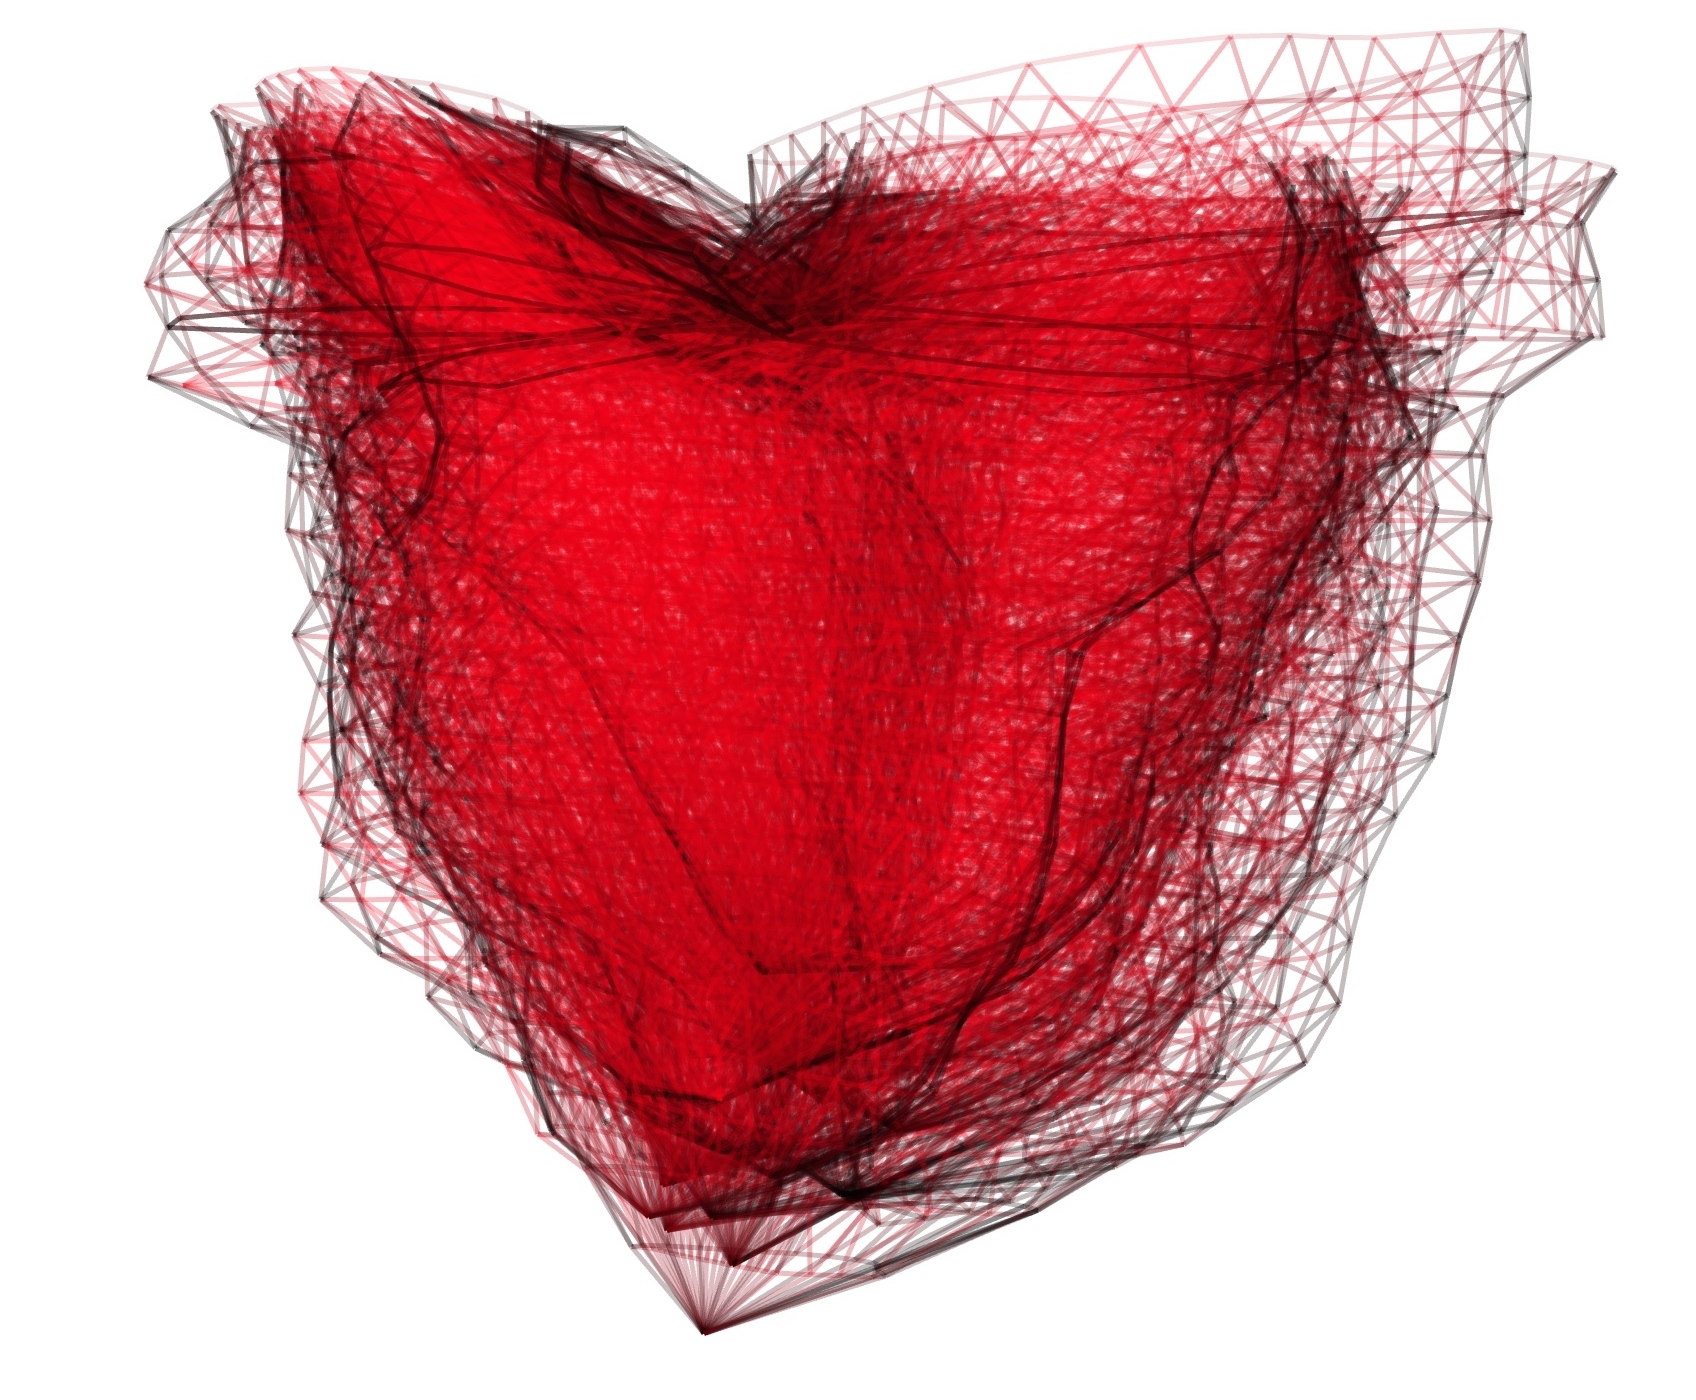 | 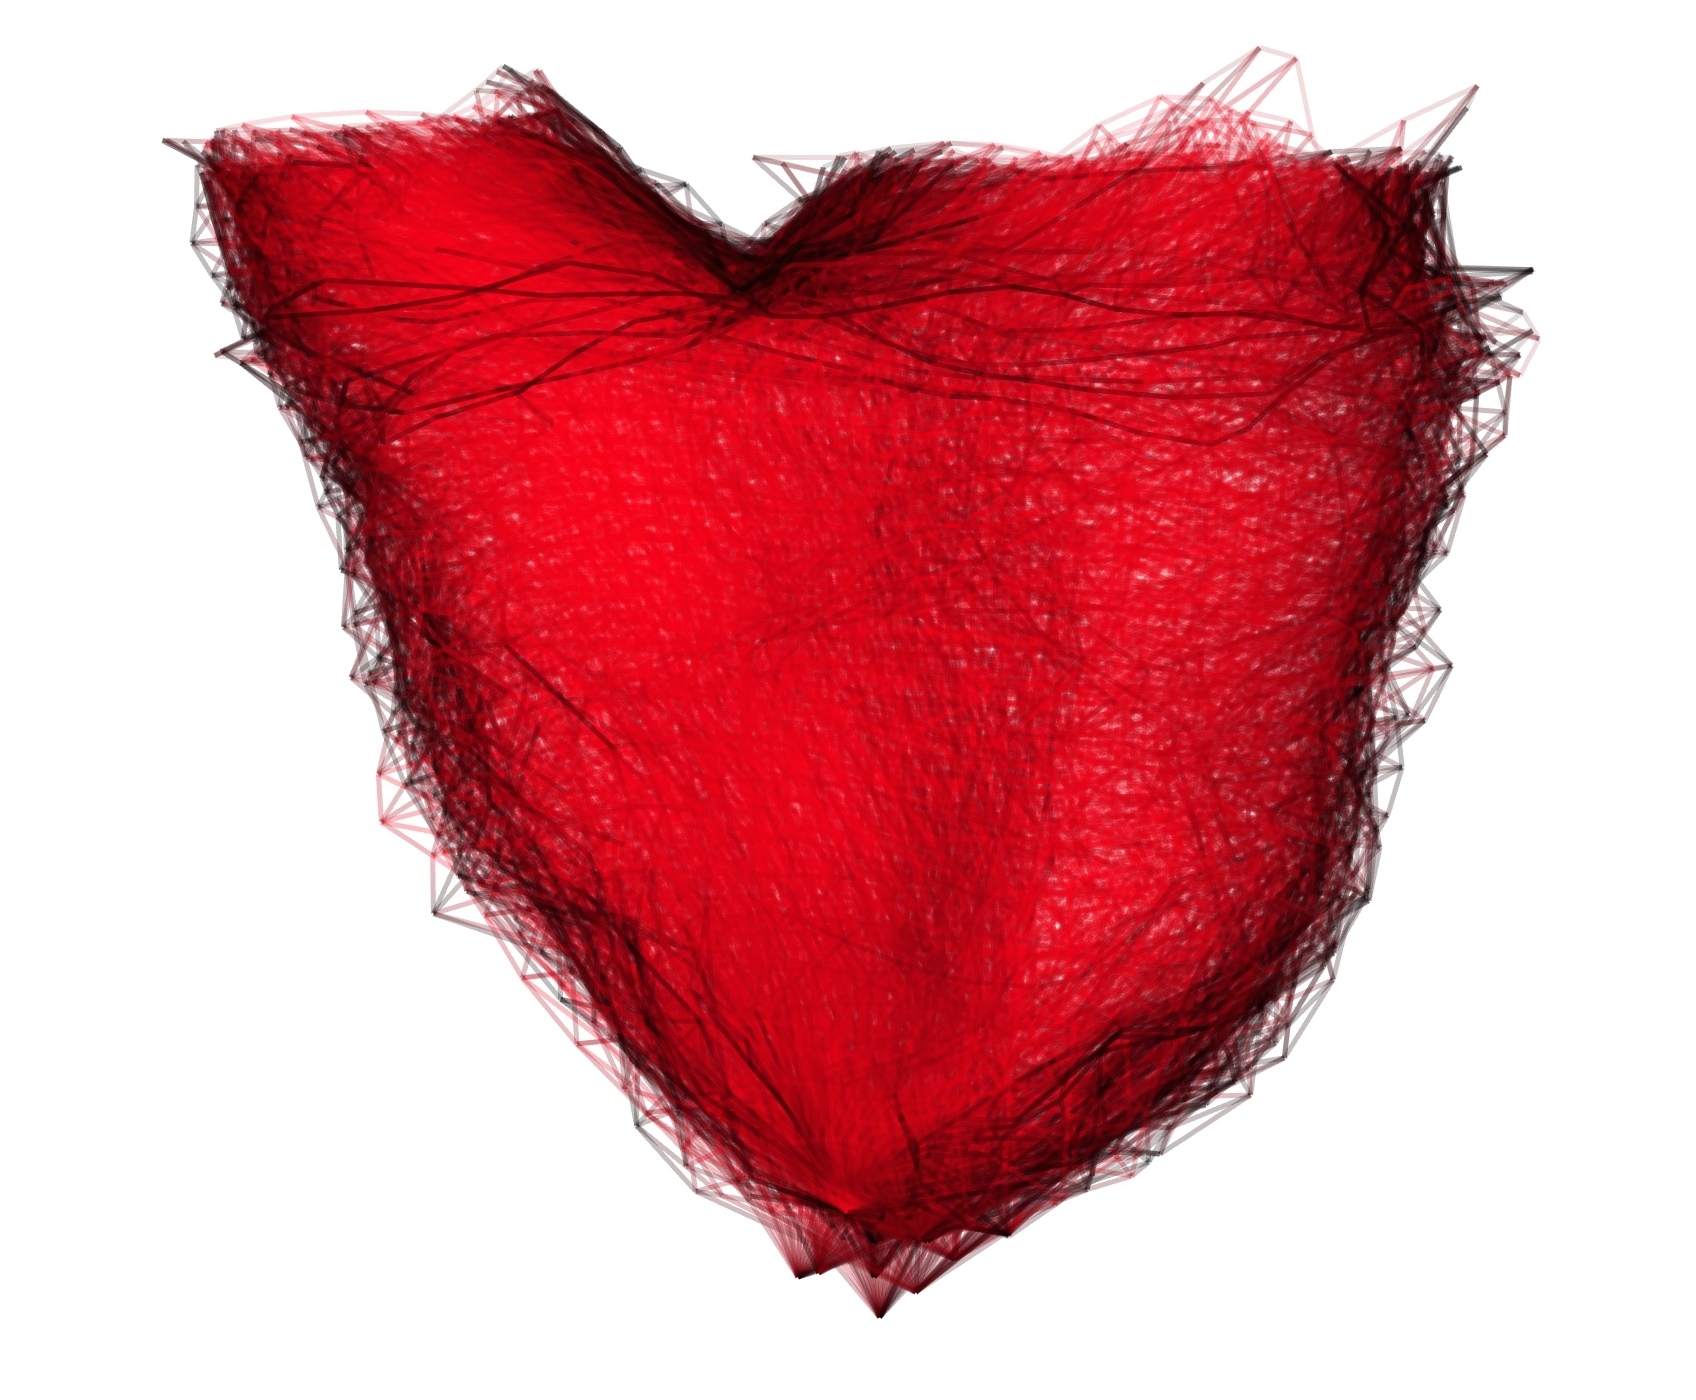 |
| Rigid alignment | Non-linear registration to the template |
1. Characterising Deformation Modes of RV Shapes in ToF
In this work we analyse the deformations ϕi only as we mainly focus on
the regional changes of the RV anatomy due to ToF. Principal Component
Analysis (PCA) is performed directly on the moments βi to extract the main
deformation modes. The elements of the covariance matrix Σ are given by
Σij =< v0i -v0,v0j -v0 > V = ∑
xk,xl(βi(xk) -β(xk))KV (xk,xl)(βj(xl) -β(xl)),
xk being the position of the kth Dirac delta current of T. Then, the moment vector
γm of the initial speed vector u0m related to the mth deformation mode is given by
γm = β + ∑
iVm[i](βi -β). In this equation, Vm is the mth eigenvector of Σ when
the eigenvalues are sorted in decreasing order. Finally, the RV shape of each patient i
is characterised by the shape vector si = {smi}m=1..M computed from the M first
deformation modes, smi =< v0i,u0m > V = ∑
xk,xlβi(xk)KV (xk,xl)γm(xl).
2. Can We Predict the Shape from Clinical Parameters?
First, cross-sectional analysis of the impact of growth on RV shape was performed.
Multiple linear regression between the shape vectors si and body surface area (BSA)
was carried out to exhibit the effects of BSA on each deformation mode. An
optimal set of modes was selected by iteratively removing the modes with
lowest significance, until the p-value of the regression overall significance
stopped decreasing. Canonical Correlation Analysis (CCA) was then applied to
quantify the amount of variation of each mode when BSA varies. Denoting R
the overall correlation coefficient between BSA and shape vectors and ρ the
correlation vector relating BSA to each deformation mode, the moments μ of the
generative deformation Φ are μ = R ∑
kρ[k]γk. Deforming the template
 with Φ enables quantifying the average RV remodelling observed in our
population.
with Φ enables quantifying the average RV remodelling observed in our
population.
3. Statistical Model of RV Remodelling in ToF Patients
Patient growth was quantified by body surface area (BSA) index (correlation with
age in the data set: R2 > 0.5, p < 0.001). Model reduction discarded all the non-significant
modes. The remaining modes were found clinically pertinent by
an expert after visual inspection. Mode 1 clearly represented the
overall RV dilation. Mode 2 seemed to model the dilation of the tricuspid
annulus and of the inflow tract. Mode 3, 6, 7 and 9 exhibited a dilation of
a specific RV region: apex (mode 3), basal area under the tricuspid valve
(mode 6), apical area of the outflow tract (mode 7) and outflow tract (mode
9), reflecting possible direct impact of regurgitations on the neighbouring
tissues.
|
|
10 first deformation modes extracted by PCA on a population of 18 patients suffering from repaired Tetralogy of Fallot.
|
Canonical Correlation Analysis (CCA) provided a generative model of the RV
remodelling observed in our population. Overall correlation coefficient with BSA
was R = 0.87, suggesting a strong correlation between these deformation
modes and growth. The correlation vector of the deformation modes was
ρ = {-0.56,0.45,-0.35,-0.33,-0.33,-0.37}. When BSA increases by 0.86,
each deformation mode m varies by its related coefficient ρ[m]. The model
was found clinically realistic by an expert (See video below). As BSA increased, RV
volume increased, RV free-wall and valves dilated, and septum was more
concave. Indeed, dilation of the valves reduces the remaining pulmonary
obstructions, thus decreasing the RV pressure. As a result, left-ventricle pushes the
septum towards the right ventricle, making it more concave. However, as
regurgitations are still present, the RV still dilates by pushing the RV free wall
outwards.
|
|
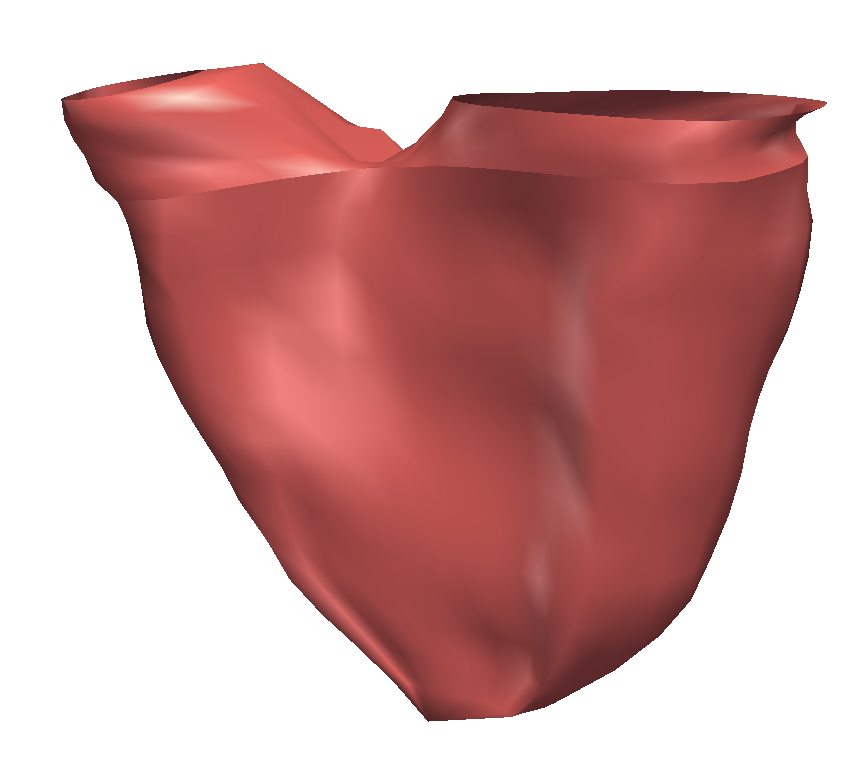
Mean RV remodelling observed in our population when body surface area (BSA, in m2) increases. RV dimensions globally increase while valves dilate. Simultaneously, RV free wall becomes rounder and septum more concave.
|
4. Validating the Generalisation of the Statistical Models
Generalising a statistical model of RV remodelling is crucial for patient management and therapy planning. We thus tested the robustness of our model on two new patients with matched age (13 and 16). The template was registered to the patients and the related shape vectors s were computed. BSA were calculated from the optimal linear model estimated in Sec. 3.. Results successfully compared with measured values (patient 1: estimated BSA: 1.61, measured BSA: 1.49; patient 2: estimated BSA: 1.29, measured BSA: 1.16). This suggests that the deformation modes involved in the RV remodelling model could be generalised, constituting potential quantitative parameters of remodelling in ToF.
References
