
![]() 1.8 NEW FEATURE !!
1.8 NEW FEATURE !!
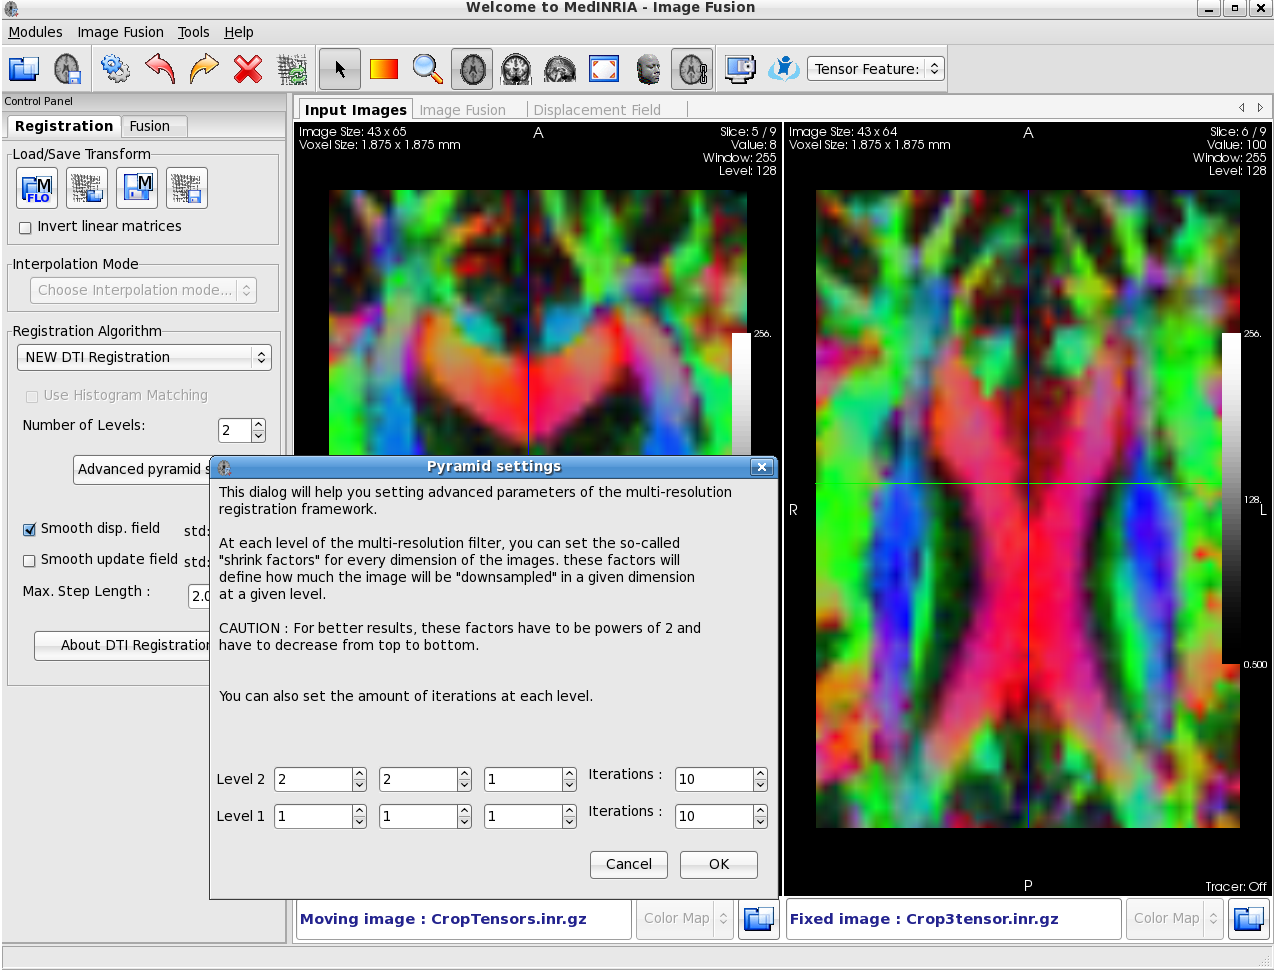
The ImageFusion module is now able to open and process Diffusion Tensor Images (DTI) extracted from DTITrack module for example. The ImageFusion module then proposes to process either manual rigid landmark based registration, and non-linear "Diffeomorphic Demons based" registration. Output resampled tensor image can be saved for further use. The visual comparison between tensor field is done by extracting features from the tensor fields such as the Color Fractional Anisotropy maps as shown here.
![]() 1.7 NEW FEATURE !!
1.7 NEW FEATURE !!
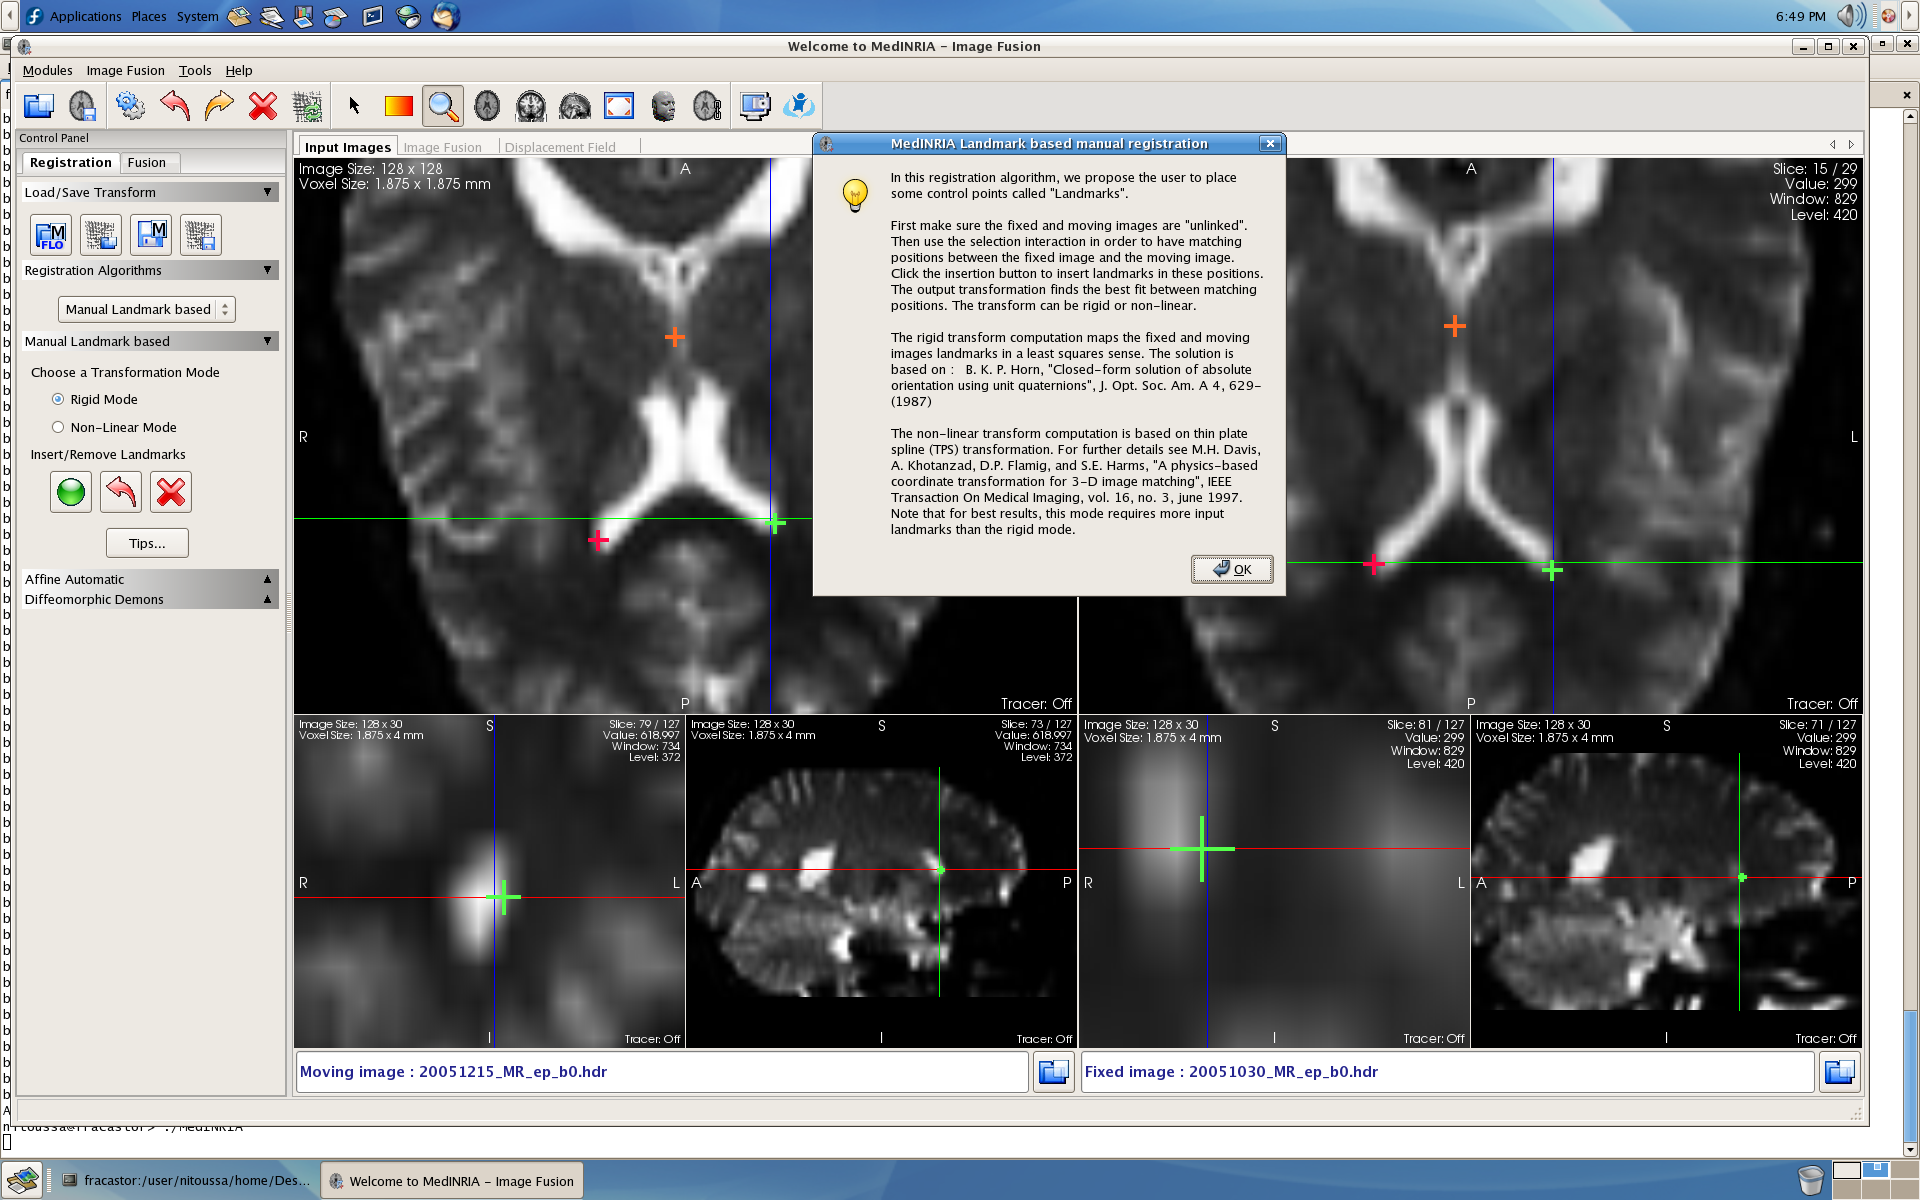
Manual registration is now done with a landmark adding procedure. The user is asked to place matching points in the input images. Output transformation can be either rigid or non-linear. This easy to use feature allows more control and more accuracy on the output transformation.
![]() 1.7 NEW FEATURE !!
1.7 NEW FEATURE !!
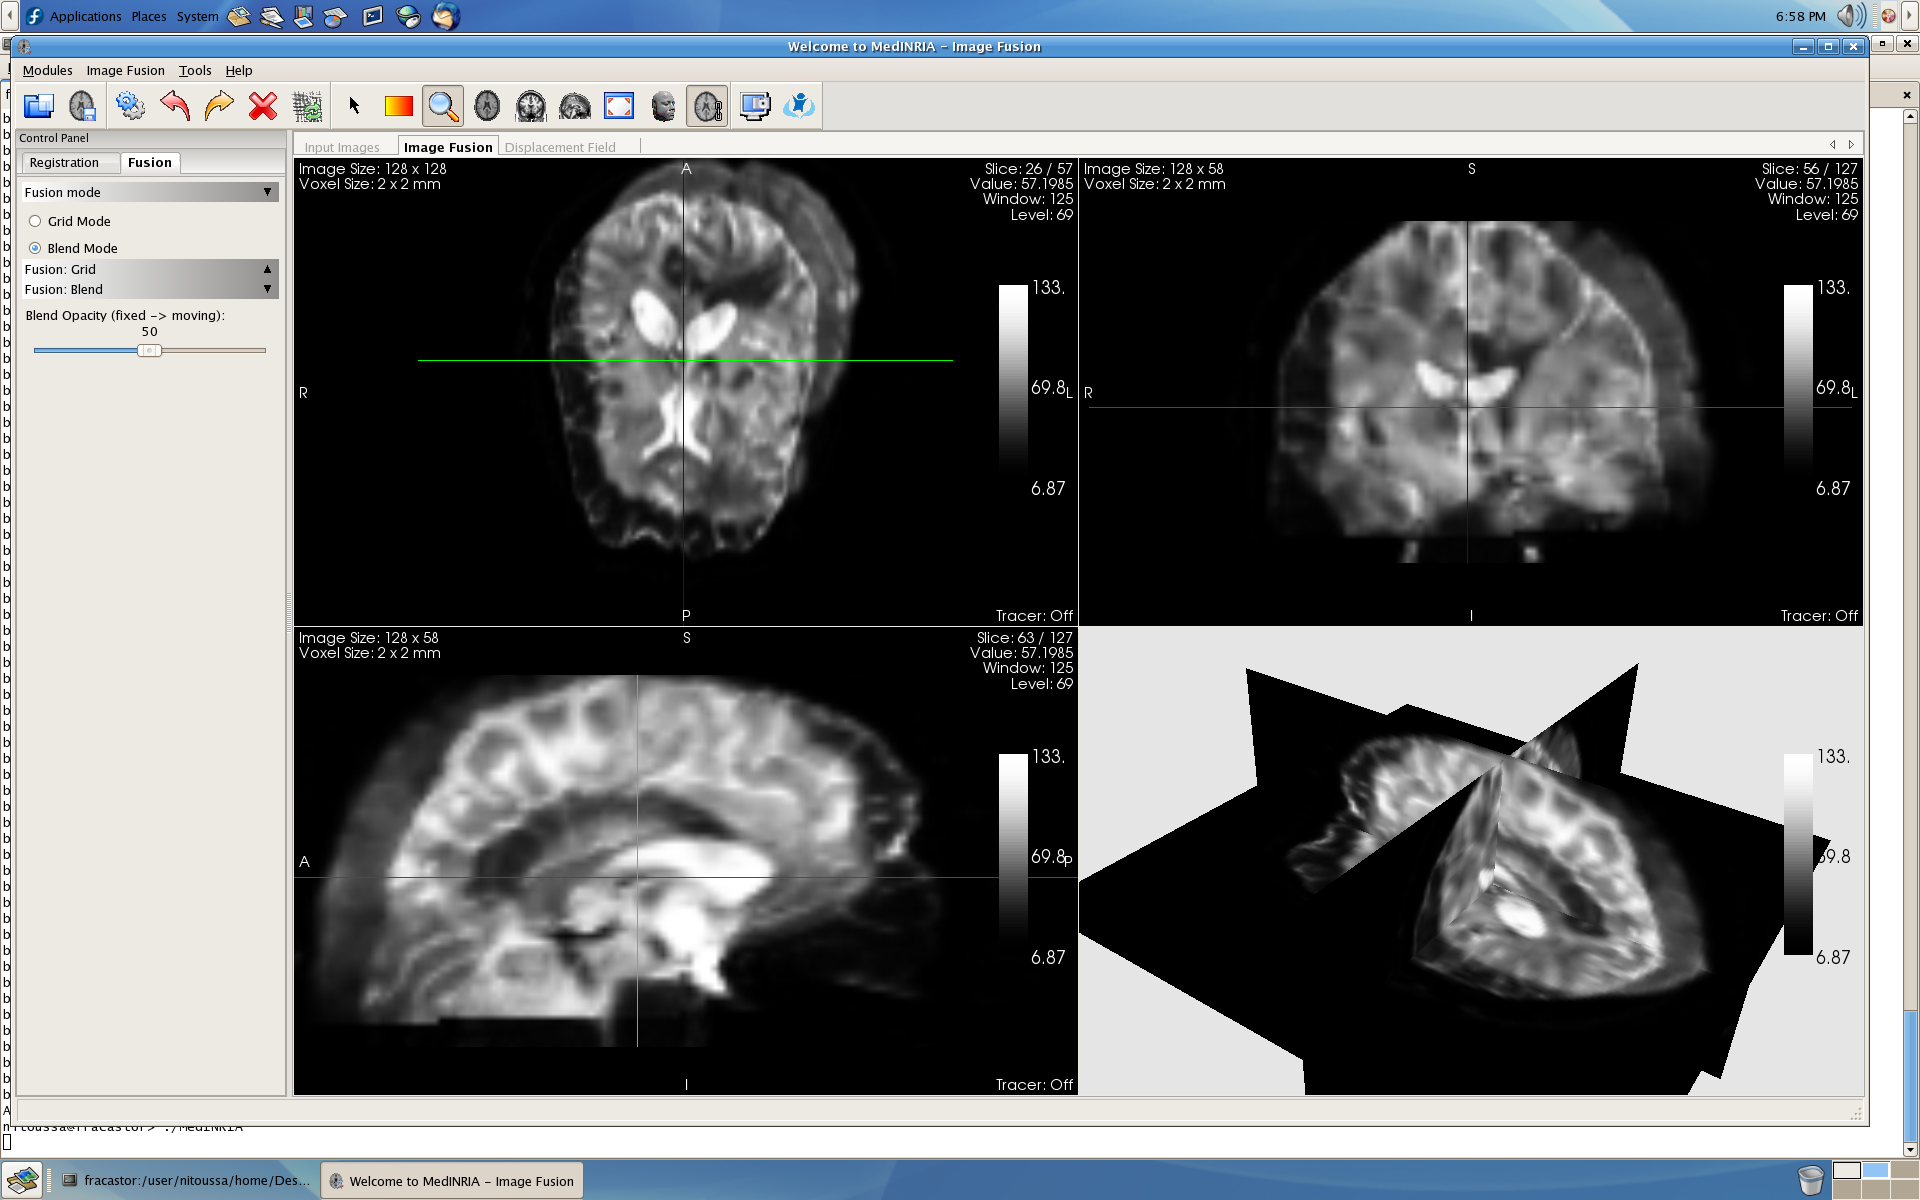
In the new module ImageFusion, you are able to undo and redo registration steps while having a look on the results by fusin the target image with the current registered image. This allows you to estimate the efficiency of each registration step (rigid/affine/non-linear).
![]() 1.7 NEW FEATURE !!
1.7 NEW FEATURE !!
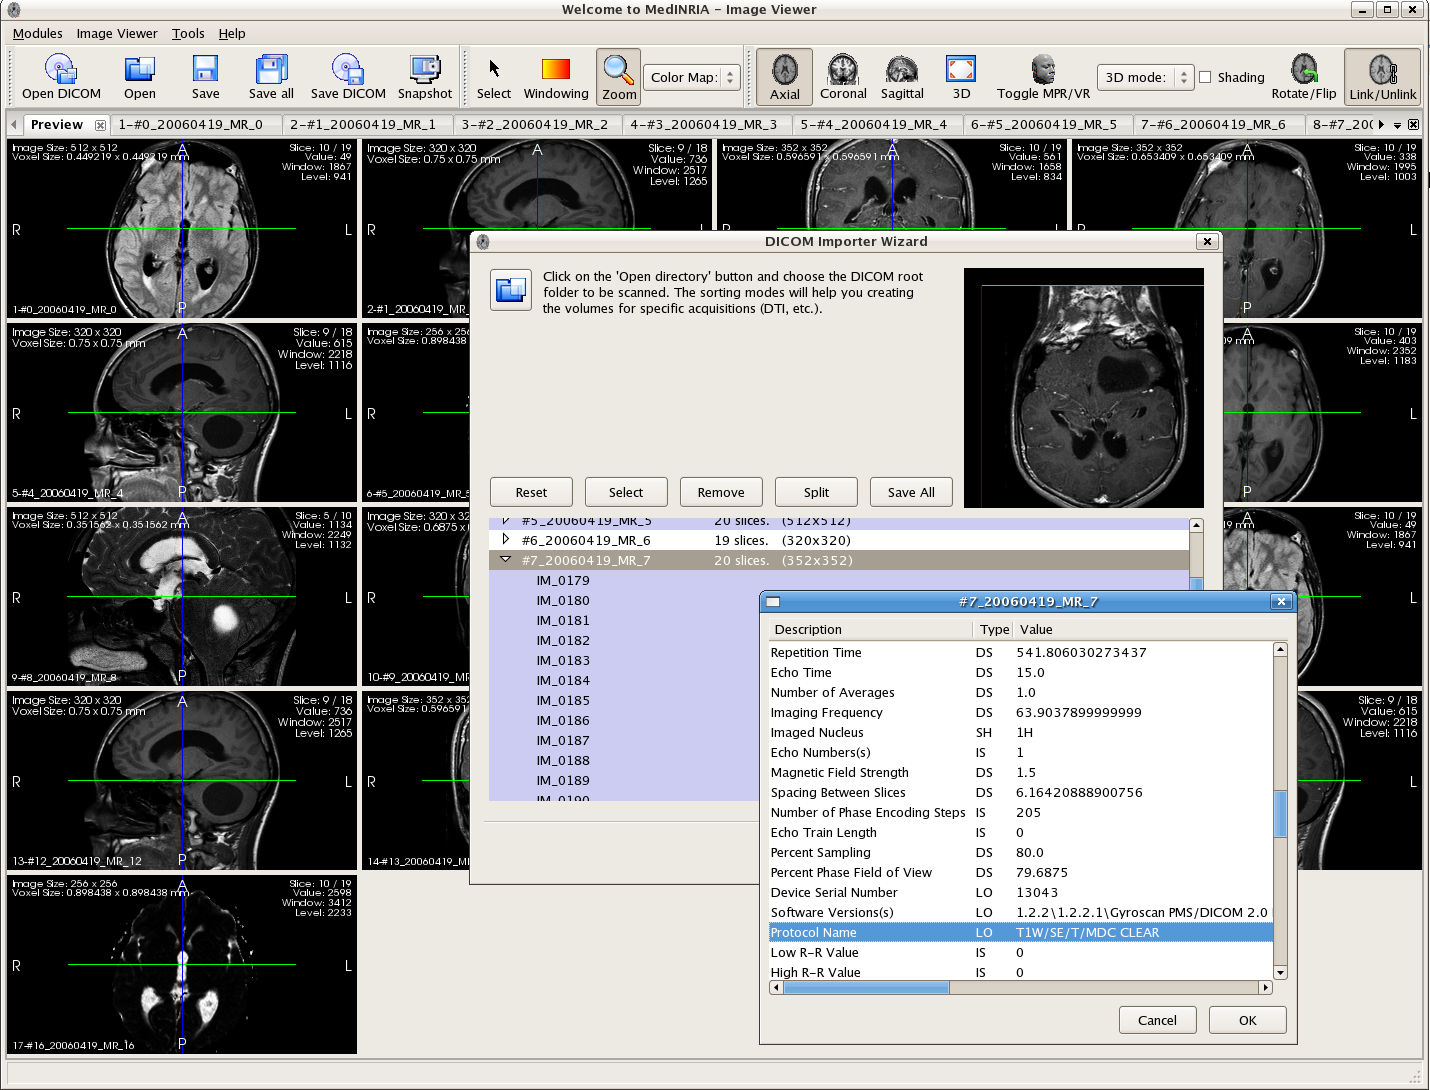
MedINRIA is now able to display DICOM information during the DICOM exam import. For that simply right click on a volume in the Importer Wizard, and pop up a window showing all information you might need !
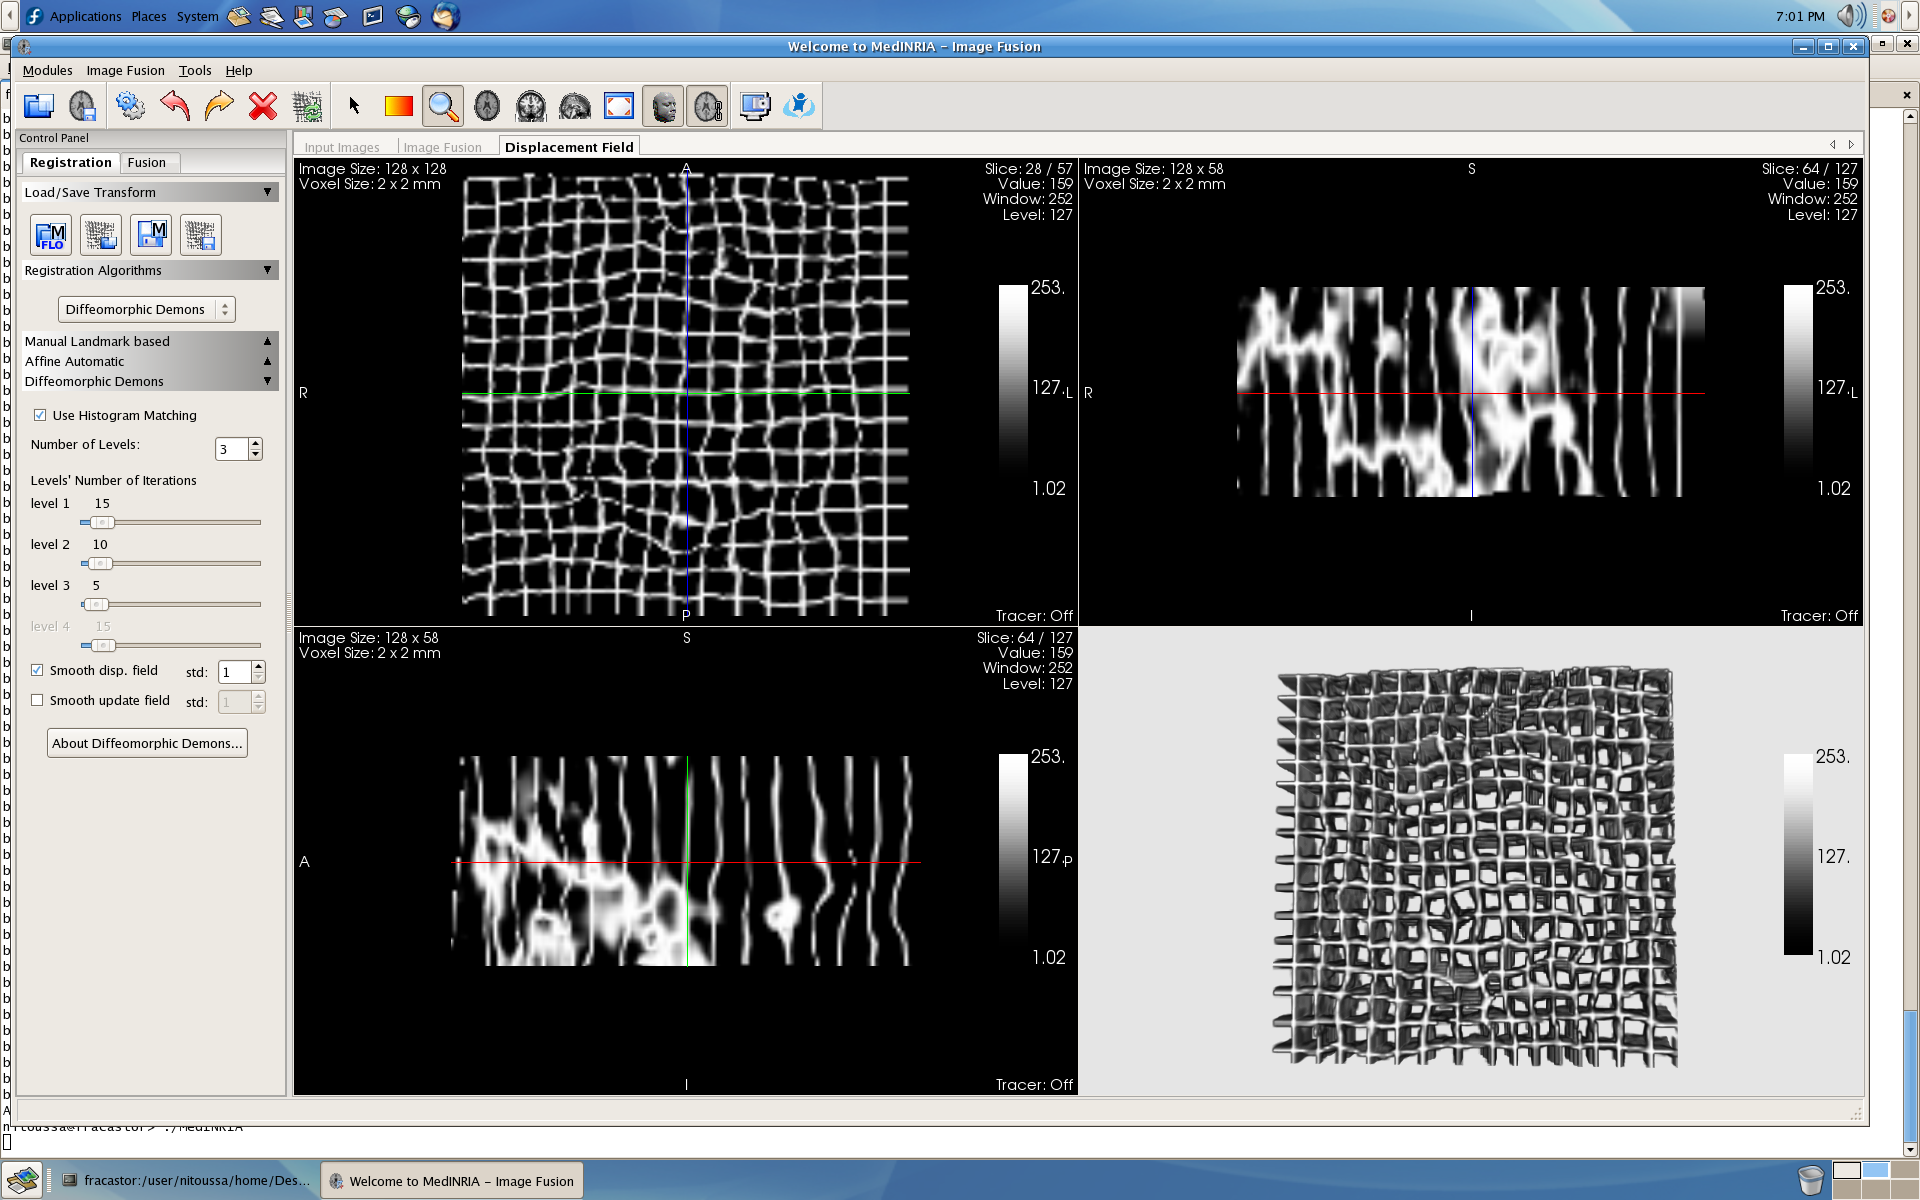
ImageFusion offers a non-linear technique for image registration. The user can alternatively use the different registration techniques for optimal results. The process ends up with a deformation field (or a linear matrix) that can be visualized in the compare view as a regular grid wrapped by the deformation field.
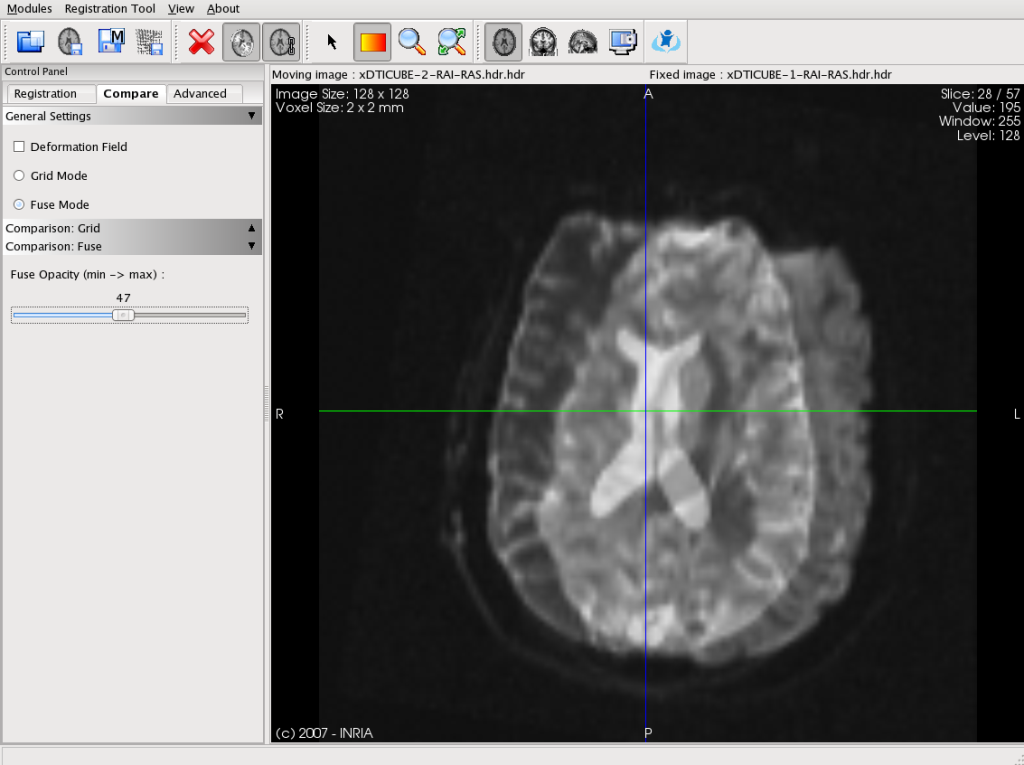
ImageFusion provides two modes of image comparison. The first mode fuses the first image and the second one by blending them with an alpha value that the user can change. The second mode uses a checkerboard technique: the view is divided in squares (the number of squares can be changed), and one square out of two contains alternatively the first and the second image.
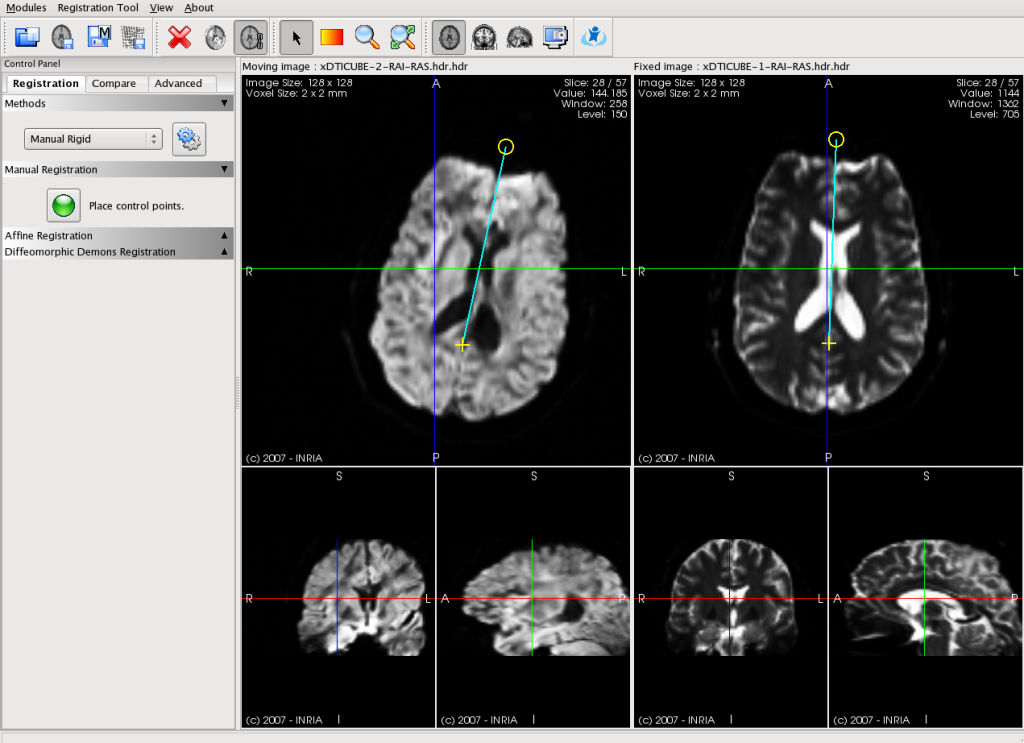
MedINRIA now includes a new module dedicated to image registration. This screen shot shows a manual rigid registration process. This is done very simply by asking the user to place in both fixed and moving images a point plus a direction. The two points are used to compute the translation, and the directions are used to calculate the angle of rotation.
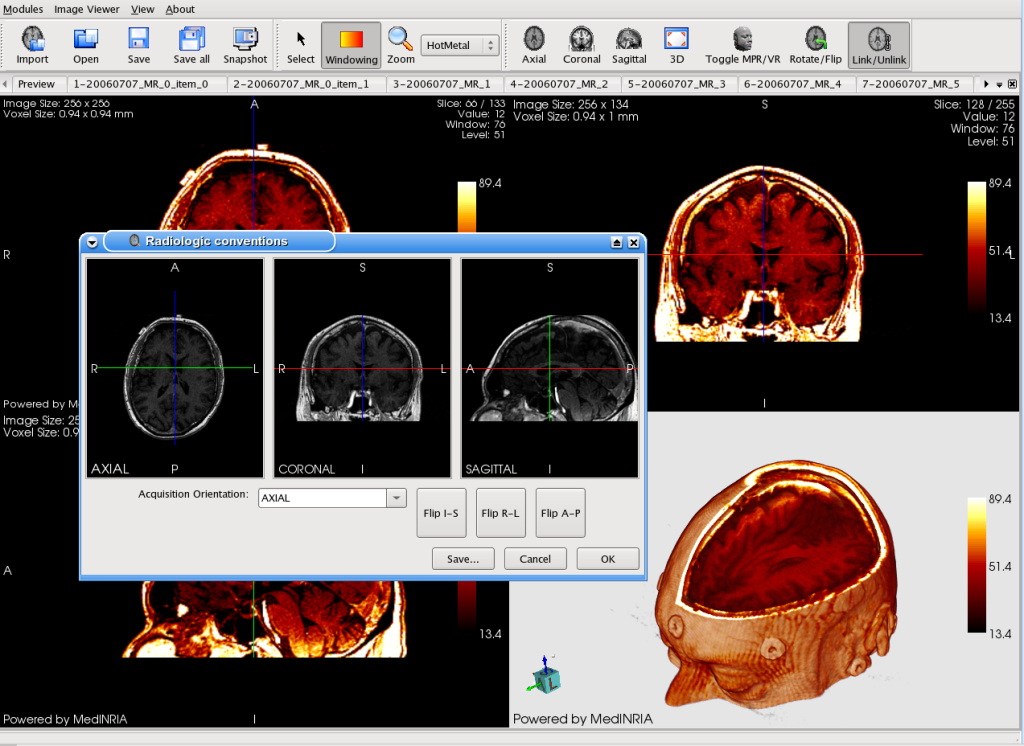
MedINRIA ImageViewer upgraded to have more visualization skills such as the choice of color maps. It aslo includes a tool to reorientate the image in case of problems matching the radiologic conventions.
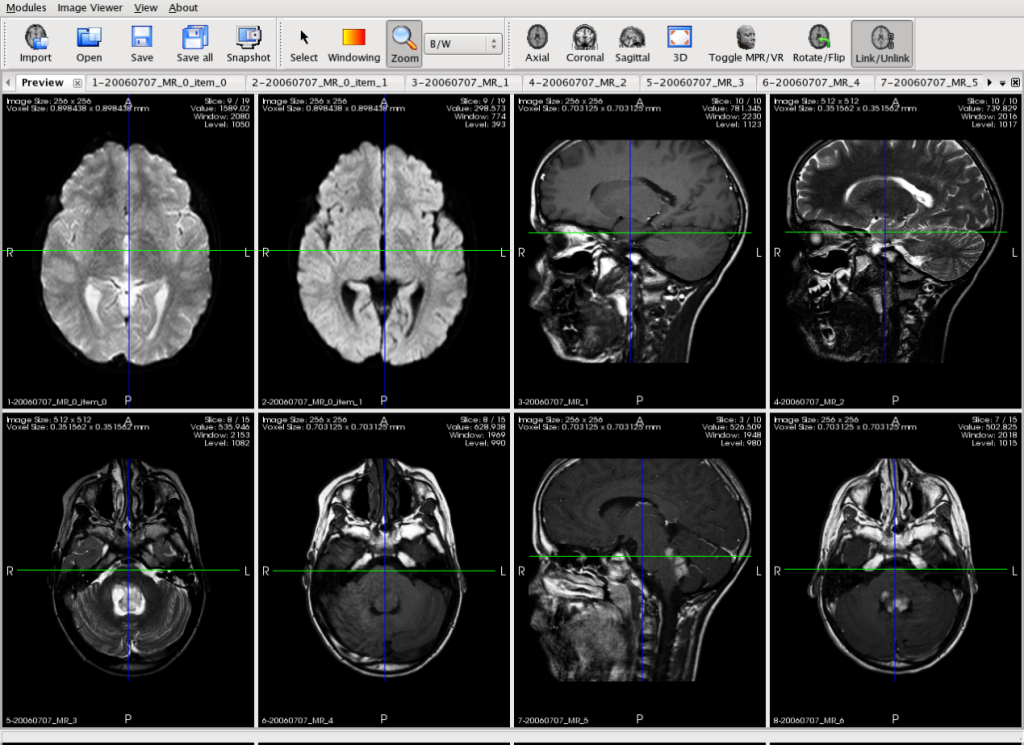
MedINRIA ImageViewer module is now able to reconstruct images directly from a DICOM exam. In a few clicks, a wizard helps you importing the exam and you can visualize them together in the preview screen.

The projection is here shown in full screen mode. You can define new Regions Of Interest thanks to the additional information given by the path of the fiber tract in this specific slice.

MedINRIA DTITrack module is now able to project fiber bundles in the 2D views in order to better visualize their path. Here statistics of the fiber bundle are also shown
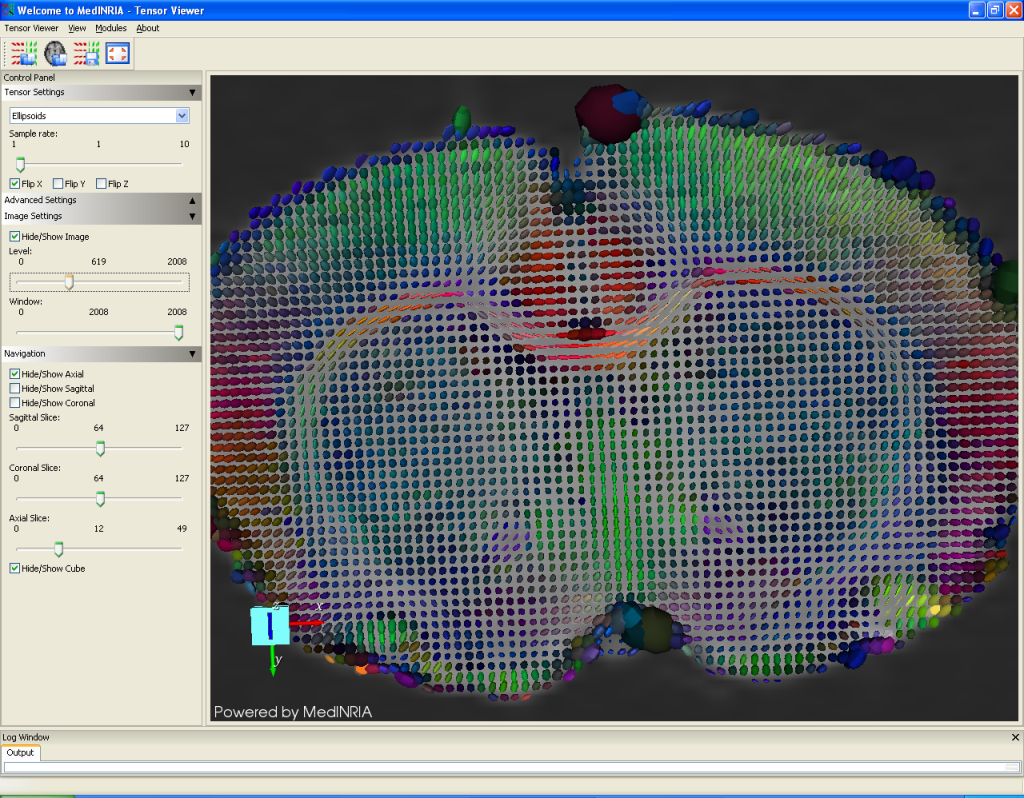
Image courtesy of Yohan van de Looij, Ph.D.

In the Tensor viewer module, you also have the possibility to overlap an image (e.g. the B0 image) to the view and visualize it with its corresponding tensor field. In this screenshot, tensors are represented as ellipsoids.
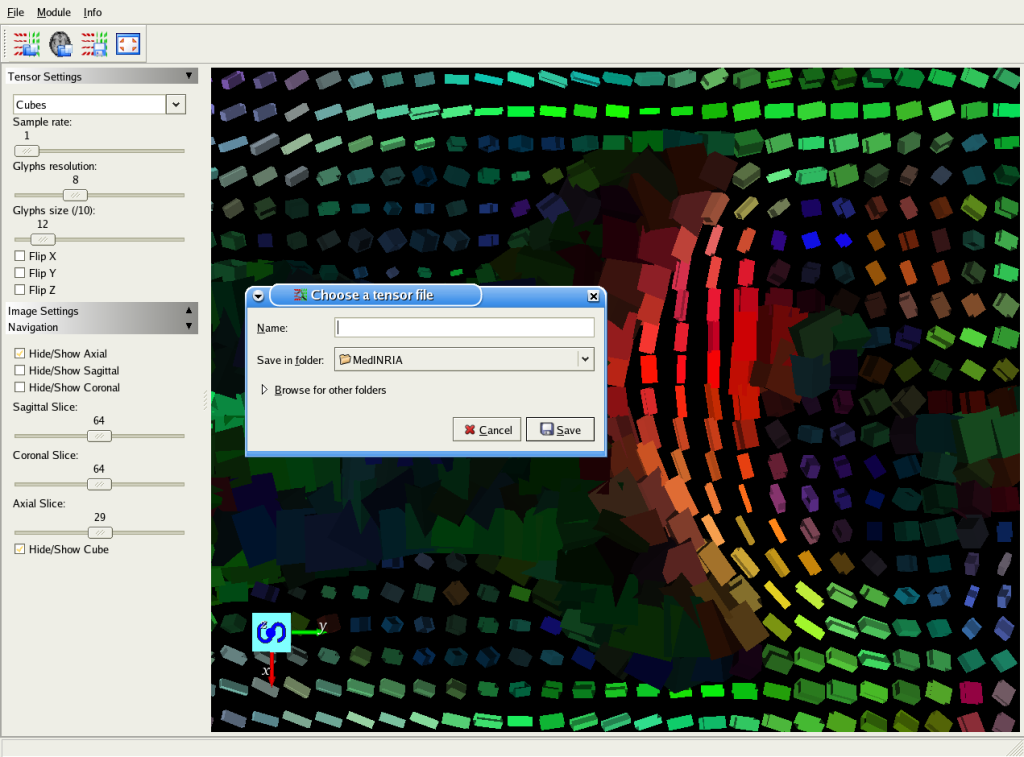
You can also flip the tensor field to tackle some acquisition geometry problems. You can then save the tensor field and use it to track fibers in the DTI-Module. This screenshot shows a part of the axial view. "cube" visualization mode has been chosen.
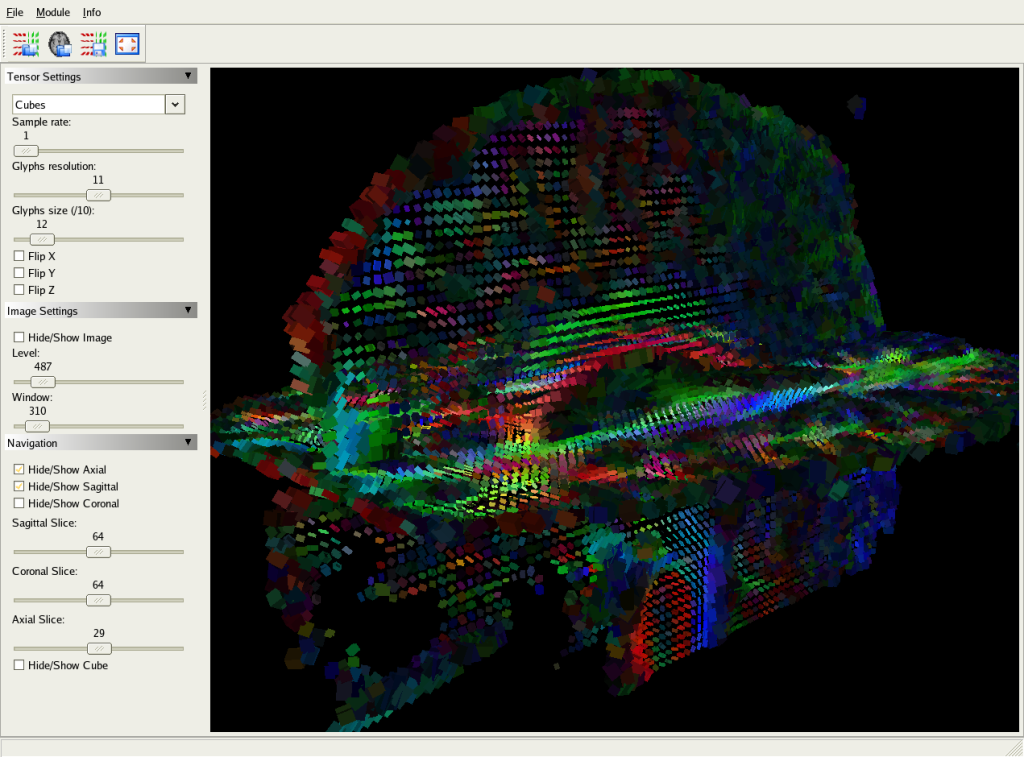
The software also provides a powerfull tensor visualization tool. Tensors are represented as glyphs, such as lines, arrows (principal eigenvector), but also cubes, ellipsoids, etc. The glyphs are colored in RGB (principal eigenvector), and intensity is weighted by the Fractional Anisotropy of the tensor.
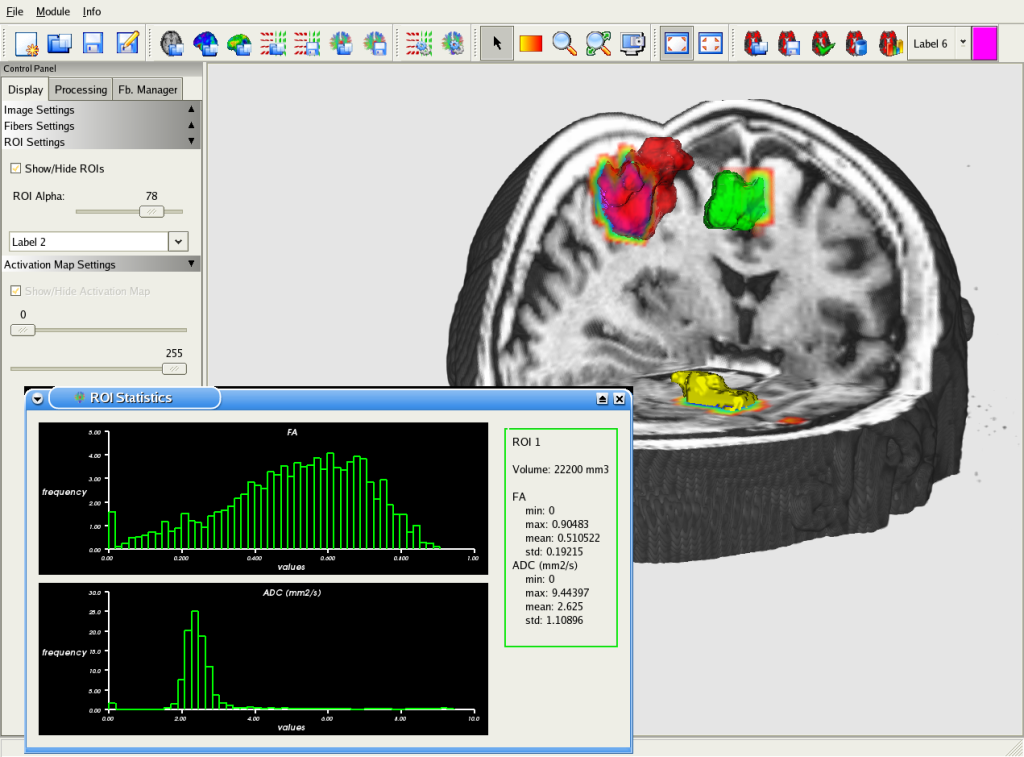
MedINRIA provides a tool that allows you to consider activated regions from fMRI as Regions of Interest. You can see on this screenshot that the colored activated regions are covered by their corresponding ROIs. You can then track the fibers that go from an activated region to another.
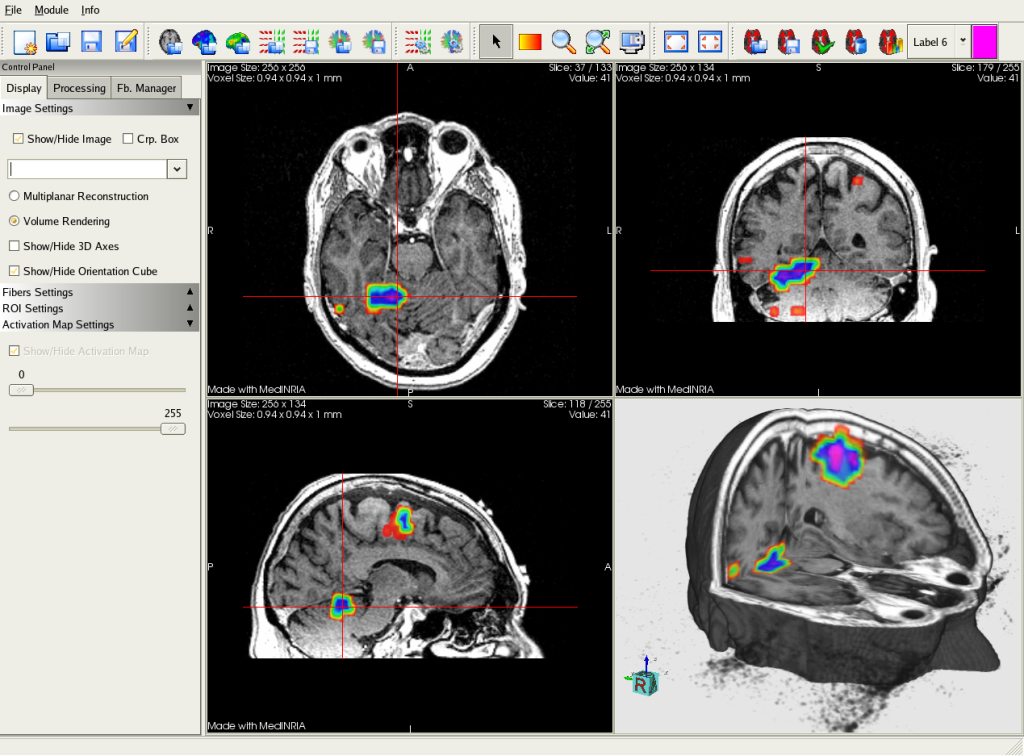
In the DTI module, you can visualize fMRI activation maps overlapped on a grey level image. This screenshot shows colored activated regions displayed on a T1 image.
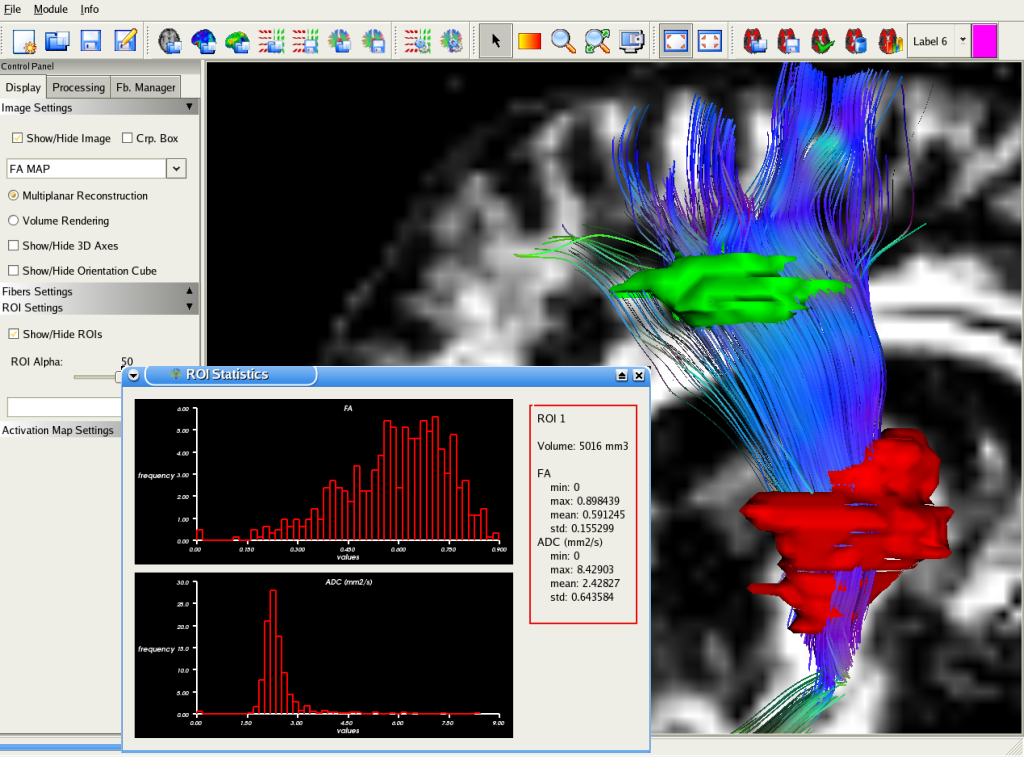
This screenshot shows a fiber bundle extracted thanks to a set of two ROIs: Only fibers that go through the ROIs are displayed. You can also output some statistical information about the ROIs, such as its volume, and histograms of scalar values (FA/ADC).
You can easily define some Regions of Interest (ROIs) that will restrict the fibers displayed to those going through the ROIs. You can load and merge two ROIs, and save them for future use.
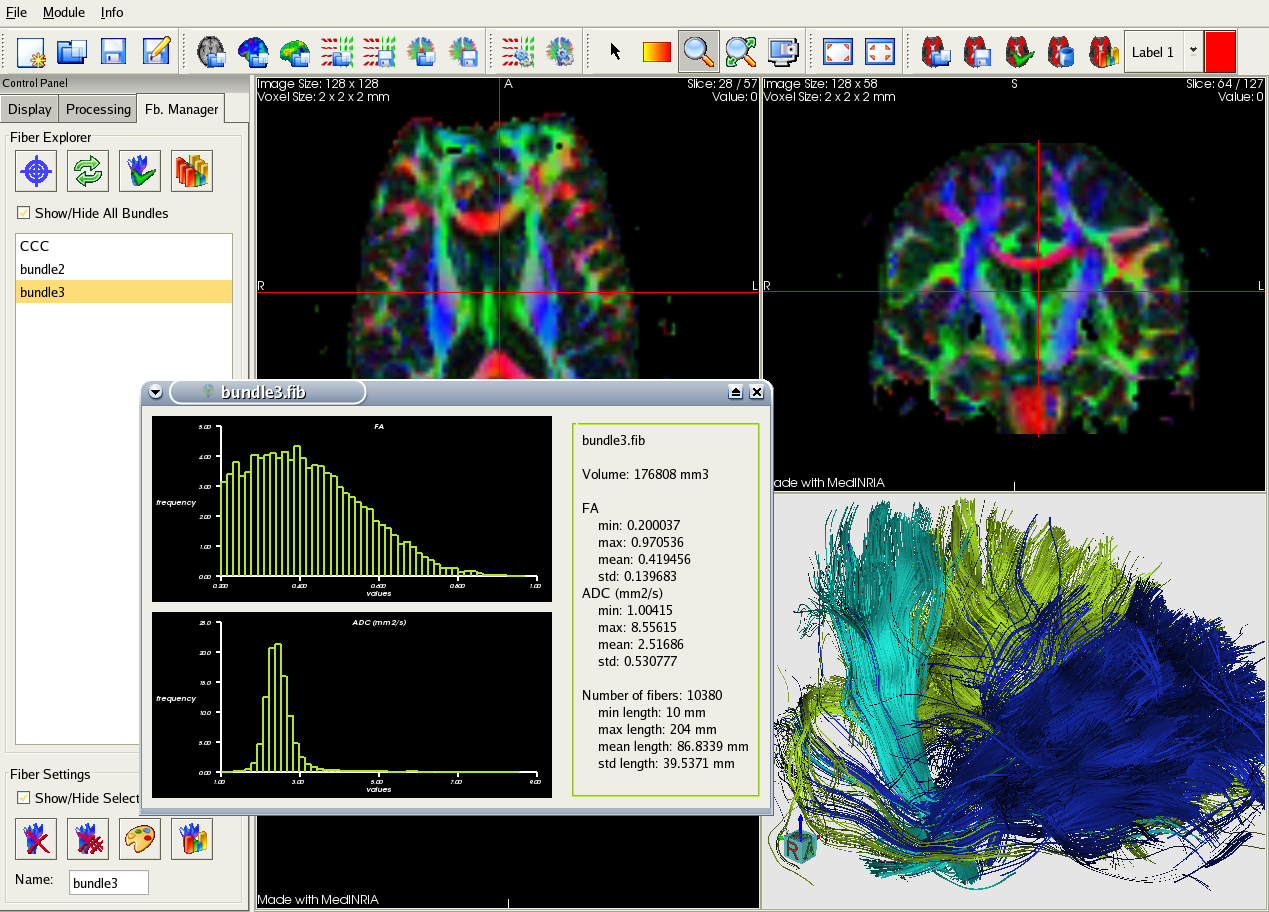
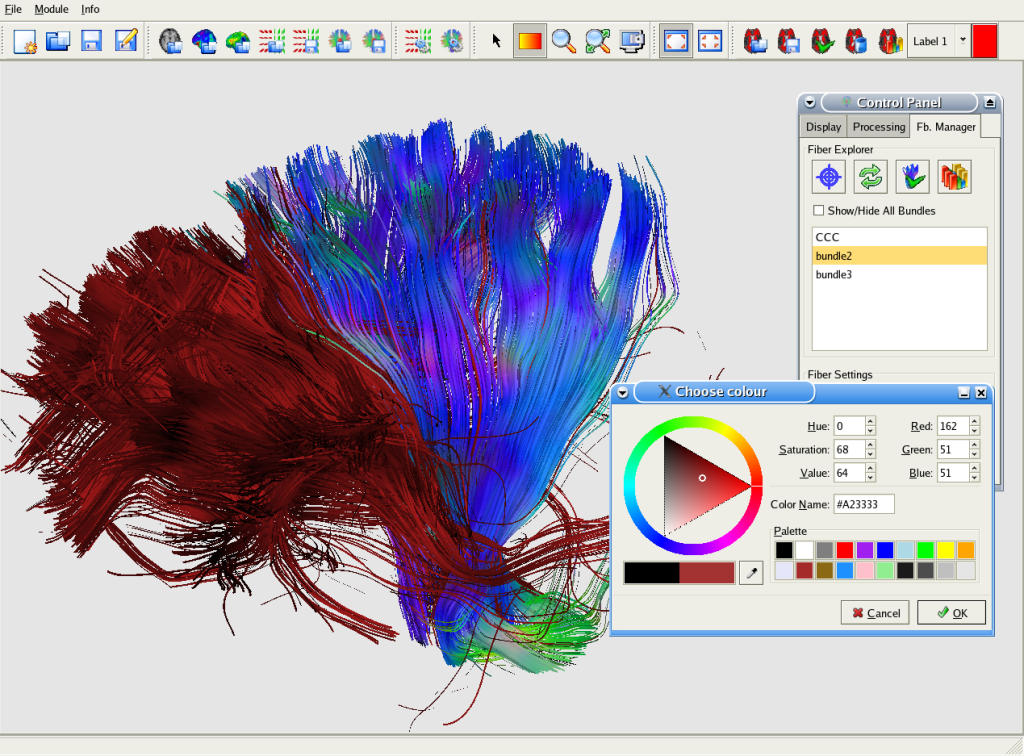
With MedINRIA, you can output statistics based on the extracted bundles such as histograms of scalar values like FA/ADC, but also statistics of fiber length. Thus, you can compare different bundles of interest statiscally.
The DTI-Module provides a powerfull fiber tracking tool. You can easily manipulate your tracking results, extract bundles of interest and save them for future use.

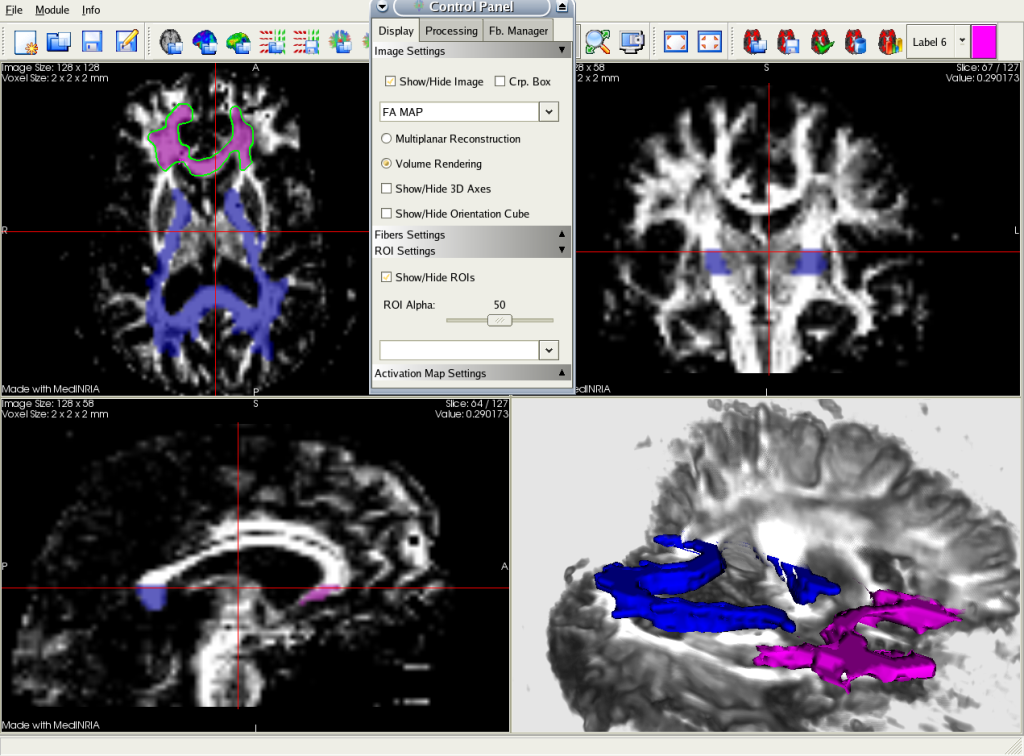
The DTI-Module provides fast tensor estimation, tensor smoothing and DTI analysis. You can consequently visualize scalar maps such as FA (Fractional Anisotropy) or ADC (Apparent Diffusion Coefficient). This screenshot presents the visualization of the FA map with an RGB color map. The color indicates the main direction of diffusion.
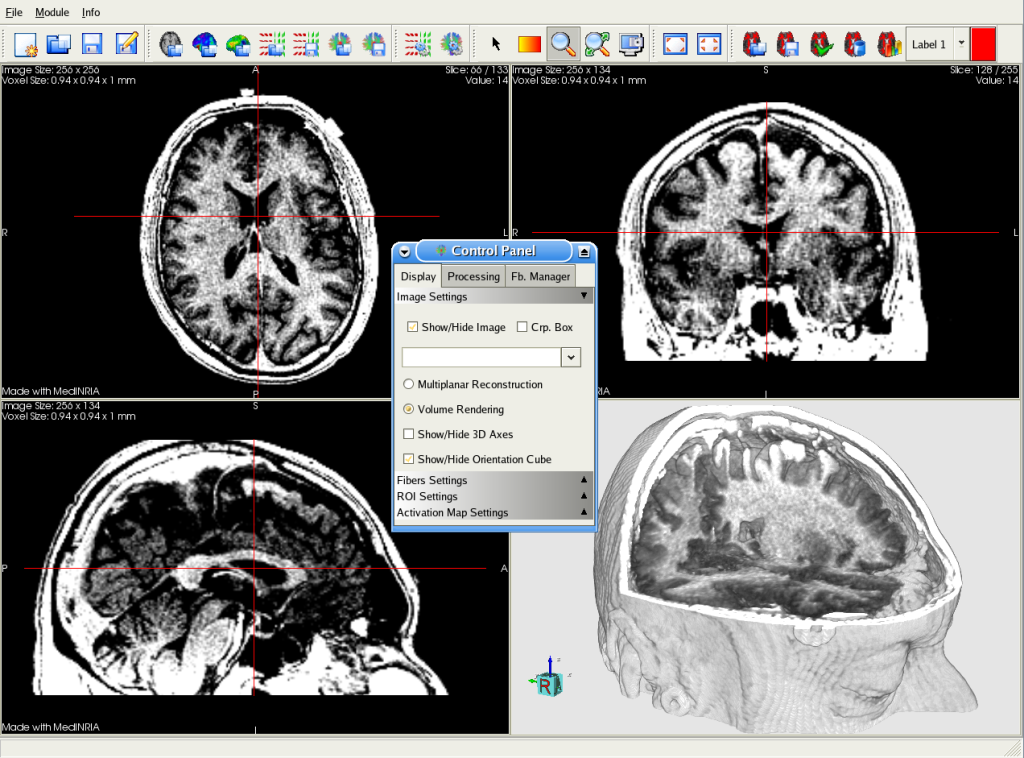
MedINRIA can be used as a fast and powerfull visualization tool. Most of the usual medical file formats are supported. You can display each of the 2D/3D view in full screen. About the 3D view, you can choose between Multi-Planar Reconstruction (MPR) or Volume Rendering (VR) as shown here.
 - Copyright 2012 - Asclepios Research Project - Inria Sophia Antipolis - http://www-sop.inria.fr/asclepios/