Description of MedINRIA's Modules
This page gives a brief description of the features of each of the MedINRIA's modules.
 ImageViewer
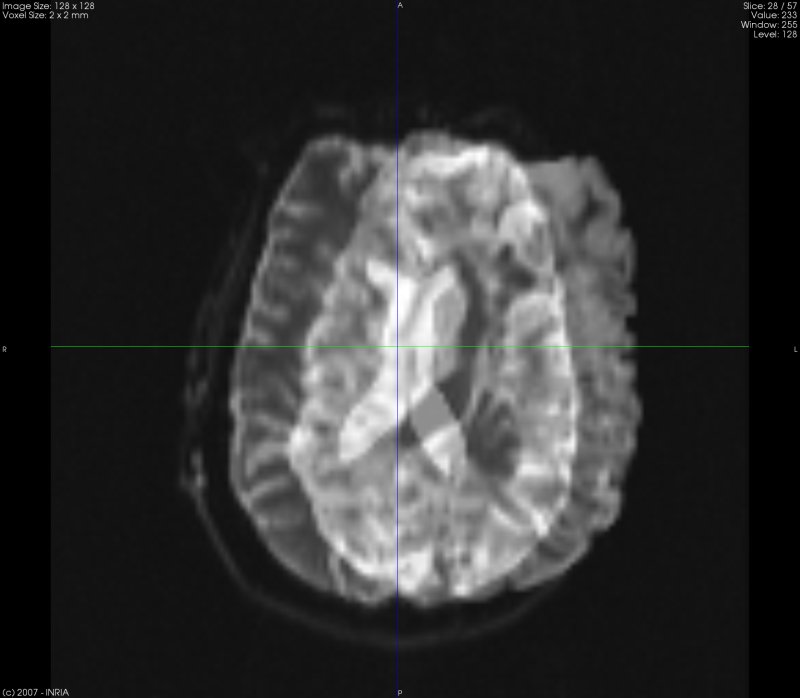
The ImageViewer is a simple yet powerful image visualization module which is able to read a large panel of medical images: DICOM, analyze, ITK MetaImage, jpeg, png, tiff, etc. User can switch between loaded images via tab-browsing, images can be re-orientated and saved.
Authors : Pierre Fillard, Nicolas Toussaint.
 DTI Track
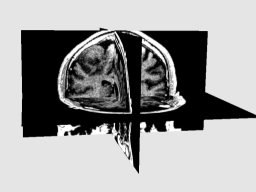
The DTI Track module provides all necessary tools for in-deep DT-MRI analysis and fiber tracking. From diffusion tensor field estimation, to FA/ADC computation, tensor smoothing, and fiber extraction, this module will help you to extract a fiber bundle of interest. Moreover, it is now possible to fuse fMRI data with fiber pathways, to determine likely paths linking activated regions. A brief descriptions of the features is given below. This module uses Log-Euclidean metrics to process tensors, protected by a patent (Filing Number 0503483).
A more detailed description of the algorithms used in this module can be found in the log-euclidean and the fiber tracking pages.
 Features (non-exhaustive list)
-
3D Image Visualization:
Fast and convenient image visualization. Most of the usual medical file formats are supported (including SPM Analyze 7.5). Multi-Planar Reconstruction (MPR) and Volume Rendering (VR) techniques are available.
-
DTI Analysis:
Fast tensor estimation, tensor smoothing and DTI analysis. Scalar maps calculation: FA (Fractional Anisotropy), ADC (Apparent Diffusion Coefficient), etc.
-
Fiber Tracking:
Powerful fiber tracking algorithm, using tri-linear Log-Euclidean interpolation. The algorithm is fully multithreaded!
-
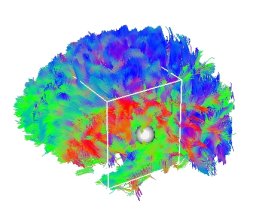
Regions of Interest (ROIs):
Manual definition of Regions of Interest (ROIs), slice by slice, on axial, coronal and sagittal views. ROIs are automatically rendered in 3D with isosurfaces. ROIs can be loaded/saved/merged.
-
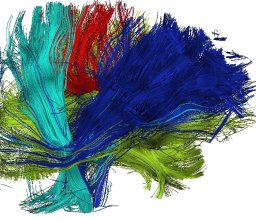
Fiber Bundle Selection:
Selection of a bundle of interest: Either with ROI definition (limit the fibers to those that go through all the ROIs), or interactively in 3D using a Cropping Box. Set a colour and a label to each selected bundle, and save your result!
-
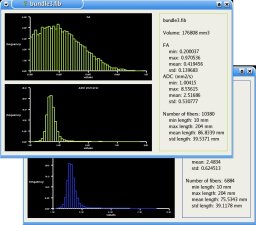
Statistics:
Statistics are computed on the extracted fiber bundles: Histograms of scalar values (FA/ADC) and fibers length bundle by bundle are given. The statistics are also available for the ROIs.
-
fMRI - DTI Fusion:
Now you can fuse your fMRI studies with DT-MRI data: Automatically create ROIs from activation maps and look for possible pathways linking activated regions!
|
|
Authors : Pierre Fillard, Nicolas Toussaint.
 Tensor Viewer
The Tensor Viewer is complementary to DTI Track. It allows you to visualize tensor fields obtained with the DTI module. Sometimes, tensors are flipped due to errors in the acquisitions or storing process. With Tensor Viewer, you will be able to check the validity of the diffusion tensors, correct a geometry problem if any by flipping the tensors, and save the result.
 Features (non-exhaustive list)
-
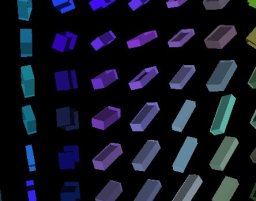
Tensor Visualization:
Visualize tensors in various ways: tensors are represented as glyphs, such as lines, arrows (principal eigenvector), but also cubes, ellipsoids, etc. The glyphs are colored in RGB (principal eigenvector), and intensity is weighted by the Fractional Anisotropy of the tensor. You can downsample the tensors for faster rendering.
-
Tensor/Image Visualization:
You can overlap an image (e.g. the B0 image) with the tensor field, and control its contrast and windowing. Monoplanar (only one plane) visualization and multiplanar (3 planes) visualization are possible, with or without the image.
-
Tensor Flipping:
The Tensor Viewer provides the possibility of flipping the tensor field among the x,y, and z axes, to tackle some acquisition geometry problems. You can then save the flipped tensors and use it to track fibers with DTI Track.
|
|
Authors : Pierre Fillard; Nicolas Toussaint.
 ImageFusion
The ImageFusion is entirely dedicated to image registration and comparison. It provides an easy to use toolkit for three types of registration :
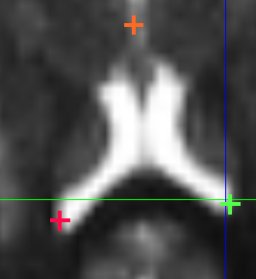
- Manual registration allows the user to register a source image to a target image in a few clicks, by placing some landmarks in the input image spaces;
- Automatic affine registration does not need any user interaction to register images with a linear affine transformation and is quite fast;
- Diffeomorphic Demons registration is a non linear process that ensure invertibility of the transform.
It also provides intuitive and easy ways of comparing two images together, as well as the possibility to visualize deformation fields.
A more detailed description of the algorithms used in this module can be found in the Block Matching, Diffeomorphic Demons and DTI registration pages.
 Features (non-exhaustive list)
-
Manual registration:
In a few clicks, one can perform a manual registration of two images. The user interacts by placing some pairs of matching points in both source and target image. The output transformation can be rigid (only translation and rotation) on non-linear. If more than two pairs are provided in the rigid more then the rigid matrix is computed to correlate the matching points in a least square way. The non-linear mode computes a deformation field thanks to the thin plate spline method.
-
Comparing Images:
The ImageFusion provides two modes of image comparison. The first mode fuses the first image and the second one by blending them with an alpha value that the user can change. The second mode uses a checkerboard technique: the view is divided in squares (the number of squares can be changed), and one square out of two contains alternatively the first and the second image.
-
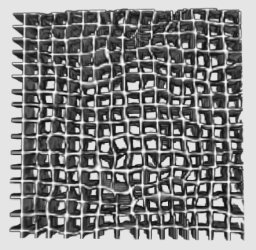
Deformation field visualization:
At any step of the registration process, one can visualize the current deformation field. The deformation field is used to warp a regular grid with it. The output grid is shown.
|
|
Authors : Nicolas Toussaint.
 SLViewer
A sulcal line viewer. This module is mainly here for internal use at Asclepios, and has no documentation yet. However, we thought that it might be useful for others, since it can read and visualize vtk files: vtkStructuredGrid and vtkUnstructuredGrid containing tensor data are visualized as ellipsoids, and vtkPolyData files are displayed using polygons.
Authors : Pierre Fillard.


 - Copyright 2012 - Asclepios Research Project - Inria Sophia Antipolis - http://www-sop.inria.fr/asclepios/