


Next: . Complete functional
Up: Supervised classification for textured
Previous: . About wavelets
We characterize textures through their wavelet decomposition.
Idea
We consider that a texture is characterized by the energy of its wavelets coefficients.
If we note  the function which represents this texture, we can write:
 |
(4.1) |
where  is the mother wavelet,
  the scaling function and
  the order of the decomposition.
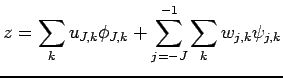
Thus, we consider that a texture is characterized by the sequence:
the order of the decomposition.
Thus, we consider that a texture is characterized by the sequence:
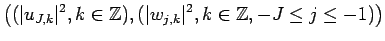 |
(4.2) |
Probability distribution of the energy
S.G. Mallat checked experimentally that the distribution of the modulus of the wavelets coefficients in a sub-band follows a generalized gaussian law of the form:
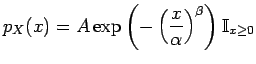 |
(4.3) |
For the energy, we get, thanks to (4.3) (with  ):
):
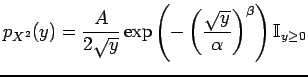 |
(4.4) |
Experimentally, we have checked that the distribution of the energy inside a sub-band is well approximated by a law of this type (see figure 6).
Figure 6:
Theoretical graph of the energy distribution in a sub-band (law (4.4)) and experimental histogram
| Theoretical graph of the energy distribution in a sub-band (law (4.4)) |
![\includegraphics[scale=0.6]{graphetheorie31param1.eps}](img45.png) |
| Histogram of the energy distribution in a sub-band |
![\includegraphics[scale=0.6]{belhisto31param1.PS}](img46.png) |
|
Next: . Complete functional
Up: Supervised classification for textured
Previous: . About wavelets
Jean-Francois Aujol
2002-12-03