


Next: How to visualize the
Up: How to use Vigie
Previous: How to save an
Contents
Index
How to run the 2D example
When a solution of a 2D problem has been loaded,
to begin the visualization, push the ``2D'' button
(the dimension of the problem) in the main window (1.1)).
A window menu appears with the names of two modes: the ``mono 2D plot''
mode and the ``multi 2D plot''
mode. Select the ``multi 2D plot'' mode, which is the last designed
and can also be used to visualize only one solution.
A working window appears (see figure 1.11) and can be used, as
described below, to visualize the solutions of the current problem.
Figure 1.11:
2D working window.
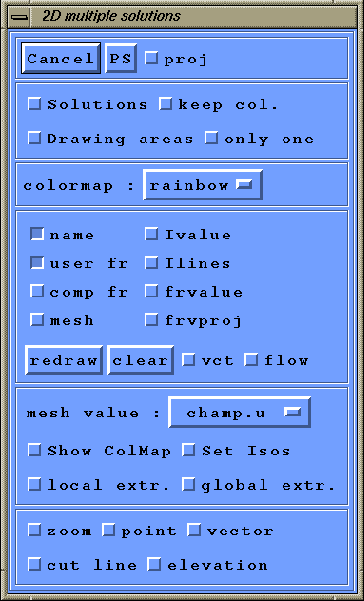 |
In the second frame, a toggle titled ``Solutions'' ``2D''
allows selection of active solutions among all the solutions of the current
problem. In the present test case the current problem has only one solution,
so you don't need to use this toggle, the default is to activate all the
solutions of the current problem.
Another toggle titled ``Drawing areas'' allows to visualize a window with
as many ``drawing areas'' as active solutions. This window will be called the
drawing window in this document.
In the following frame you choose a colormap for the drawing window, the
default is the ``rainbow'' colormap with increasing values from blue to red.
In the next frame, some toggles allows to choose what will be displayed in
the drawing window. If one of these toggles is on, the associated information
will be displayed in the drawing window when the user push the ``redraw''
button in the same frame.
Subsections
Next: How to visualize the
Up: How to use Vigie
Previous: How to save an
Contents
Index
Robert Fournier
2002-09-13