


Next: How to run the
Up: How to use Vigie
Previous: How to use Vigie
Contents
Index
How to read data
Make sure the example data set exists in a directory
you can access. Usually two files are needed, one in text format, called the
description file, suffixed by desc in which you can read the name of format
used and the name of the second
file in which data is stored. Then call the executable VIGIE:
$ vigie
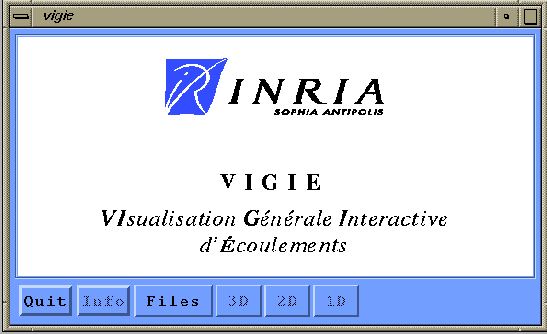
The main window appears (see figure 1.1).
Figure 1.1:
The VIGIE main window
 |
Alternatively you can also call VIGIE with the name of a description
file specified as one argument ; for example :
$ vigie ex_2d.desc
If you choose to call VIGIE without argument, you can use the
read data interface as follows :
- Push the button ``Files'' and select the menu
``Read data'' .
- A file selection box appears, (see figure 1.2). You can modify the
filter name and push on the ``Filter'' button. When you show the desired file,
a simple click on its name select the file, and a double click select it
and allows to start reading of data as if you push on the ``OK'' button after
the desired file has been selected.
- If the description file and the data file can be successfully read, the
file selection box disappears and the data read is now the current solution of
the current problem. You can obtain informations about the data if you push
the ``Info'' button in the main window. Figure 1.3 is an example
of such information window for a 2 blocks 3-D problem.
Figure 1.2:
A File-Selection box to choose the data.
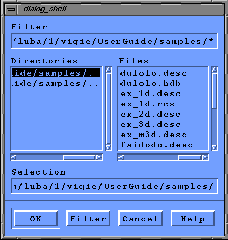 |
Figure 1.3:
Information about data.
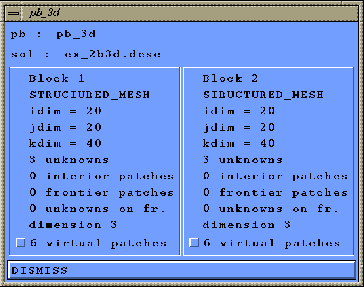 |
The information window indicates for each block defining the mesh:
- the block number.
- whether the block is structured or unstructured.
- the number of mesh nodes.
- the number of variables.
- how many element types (tetrahedra, hexahedra, prisms,...)
the mesh contains.
- informations about the boundary.
- the dimension of the problem: 1D, 2D or 3D.
VIGIE includes the possibility te define fictitious boundaries
to display particular values of interest to the user on these
boundaries. Note that the variables located on the fictitious
boundaries can be different from the ones located at the mesh nodes.
If no fictitious boundary is provided, one is automatically computed,
either there is the choice to compute a boundary
different from the fictitious one
specified by the user. For a structured block, it's the limits of the
matrix; for unstructured blocks, segments (for 2D) or facets (for 3D)
are computed. The boundary provided is often called the ``user frontier'',
while the boundary computed is refered as the ``computed frontier''.
For an unstructured block the ``computed frontier'' is created the
first time this boundary is needed.
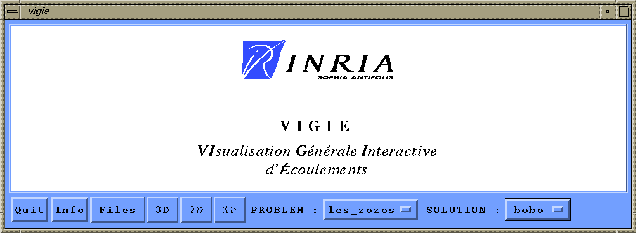
Note: You can read as many data as you want by clicking on
``Read data'' with the same VIGIE application, you can read and
visualize 1-D, 2-D or 3-D data problems. You can load several solutions of
the same problem and several problems with several solutions. In this case
the main window (see figure 1.1) is modified (see figure
1.4) and you can use the ``SOLUTION'' option menu to select a
solution of the current problem, and the ``PROBLEM'' option menu to change
the current problem. The dimension push button ``1D'', ``2D'' or ``3D'' is
sensitive for the dimension of the current problem.
Figure 1.4:
The VIGIE main window with two problems.
 |
Now you have read data, choose the chapter which corresponds to the
dimension of your problem.
Next: How to run the
Up: How to use Vigie
Previous: How to use Vigie
Contents
Index
Robert Fournier
2002-09-13