![]() You can also import activation regions as ROIs. Click on the ``Import Activation regions
as ROIs'' button to launch the wizard. The first step is a binarization of the image in
order to avoid noisy regions (see Fig. 3.19). Click on the
``open'' button to load the activation map. Left screen is the transversal view of the
activation map shown in grey level. The screen on the right is the binarized image by a
threshold that you can change thanks to the slider on the top of the window. You can
navigate in the volume by moving the mouse up and down while left-clicking on one of the
view. When you have finished binarizing the image, click ``next''. MedINRIA will
automatically find the activated regions, cluster them and associate a different
color for each.
You can also import activation regions as ROIs. Click on the ``Import Activation regions
as ROIs'' button to launch the wizard. The first step is a binarization of the image in
order to avoid noisy regions (see Fig. 3.19). Click on the
``open'' button to load the activation map. Left screen is the transversal view of the
activation map shown in grey level. The screen on the right is the binarized image by a
threshold that you can change thanks to the slider on the top of the window. You can
navigate in the volume by moving the mouse up and down while left-clicking on one of the
view. When you have finished binarizing the image, click ``next''. MedINRIA will
automatically find the activated regions, cluster them and associate a different
color for each.

|
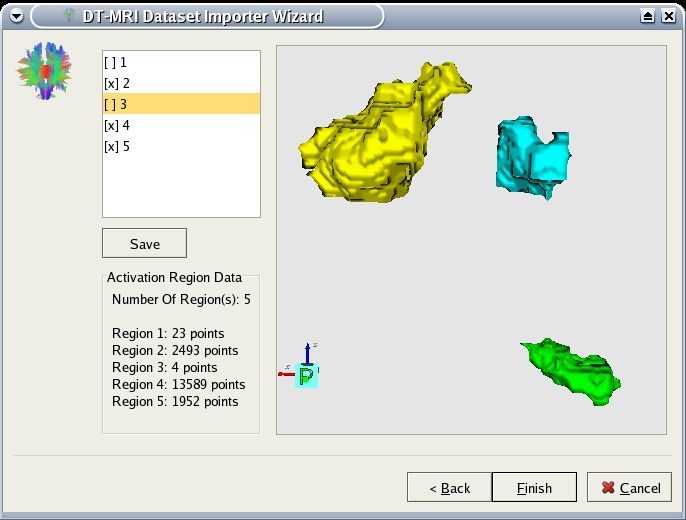
The last step of this importation wizard allows you to select the activated regions you
want to consider as Regions Of Interest. In figure Fig. 3.20 you
see a 3D view of these activated regions. You can distinguish them by color. Select
those you want to consider as ROIs in the list box on the left (see
Fig. 3.20). To help you in this choice, a summary of the regions
is shown on the lower left part of the window, displaying the volume of each region (in
voxels). You can also save the current selection for future use.

|
When you have finished selecting the regions, click ``finish''. The regions will become
ROIs in the DTI-study you are using. You can now track the fibers that go through the
activated regions you imported ! Note that the activation map must have the same
dimensions as the volume currently visualized in MedINRIA. If the activation map you want
to import doesn't have the same dimensions as the DWI of your DTI-study but has the same
dimensions of the corresponding T1 image. You must first create a DTI-study indicating the
registration matrix to use between T1 and DWI, second load the T1 image inside the
DTI-study, and finally import the activation map to create ROIs.