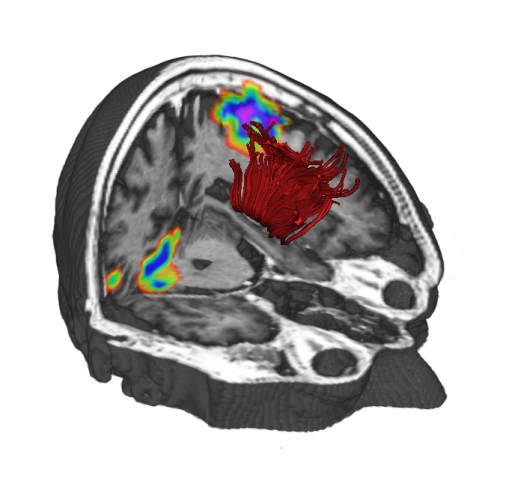
![]() With MedINRIA, you can visualize your fMRI study results at the same time as you visualize
your DTI results. Indeed, you can import an activation map assuming it has the same
dimensions as the current displayed image. For that click on the ``Open activation map''
button. It will display colored activation regions in the volume (see
Fig. 3.18). The activation regions are colored from red to purple and
going through the rainbow colors.
With MedINRIA, you can visualize your fMRI study results at the same time as you visualize
your DTI results. Indeed, you can import an activation map assuming it has the same
dimensions as the current displayed image. For that click on the ``Open activation map''
button. It will display colored activation regions in the volume (see
Fig. 3.18). The activation regions are colored from red to purple and
going through the rainbow colors.


|
 Note that if you change volume the activation map will disappear, you will have to load it
again. You can also change the color mapping by moving the activation map sliders. First
slider controls the minimum level of activation to be displayed, while the second one
controls the color saturation.