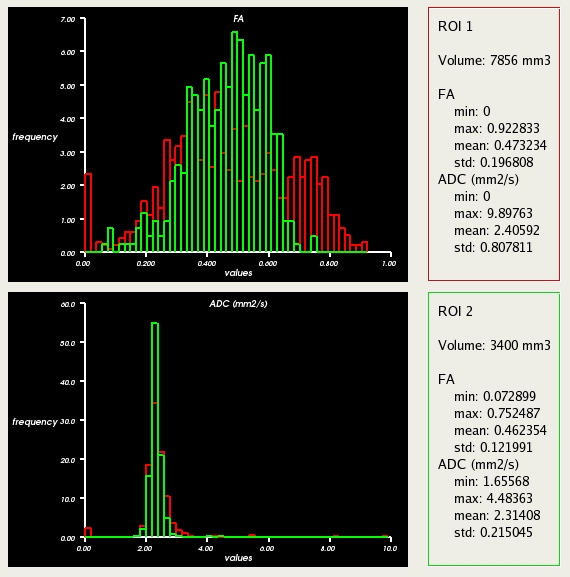
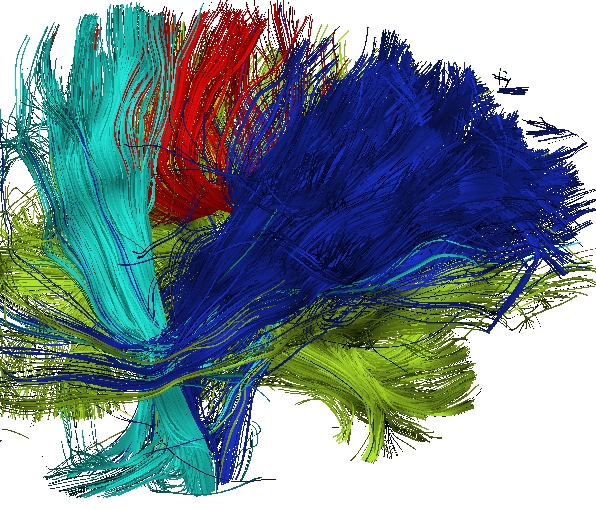
![]() When a set of ROIs is loaded, you can click on the ``ROI Statistics'' button to compute
histograms of some scalar values in the Region Of Interest. Fig. 3.15 shows
an example of these statistics. You can see histograms of Fractional Anisotropy (FA) and
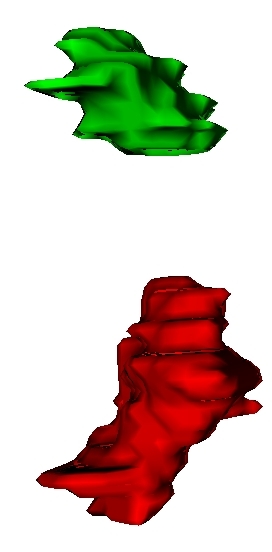
Apparent Diffusion Coefficient (ADC). The color of the graph corresponds to the color of the ROI in the views.
When a set of ROIs is loaded, you can click on the ``ROI Statistics'' button to compute
histograms of some scalar values in the Region Of Interest. Fig. 3.15 shows
an example of these statistics. You can see histograms of Fractional Anisotropy (FA) and
Apparent Diffusion Coefficient (ADC). The color of the graph corresponds to the color of the ROI in the views.
|
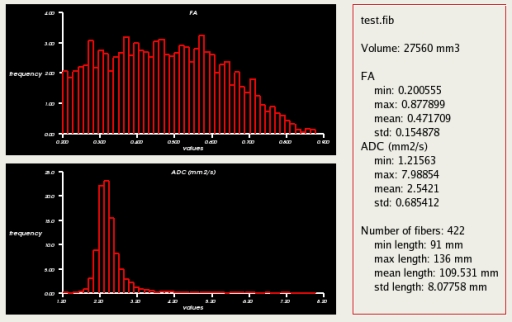
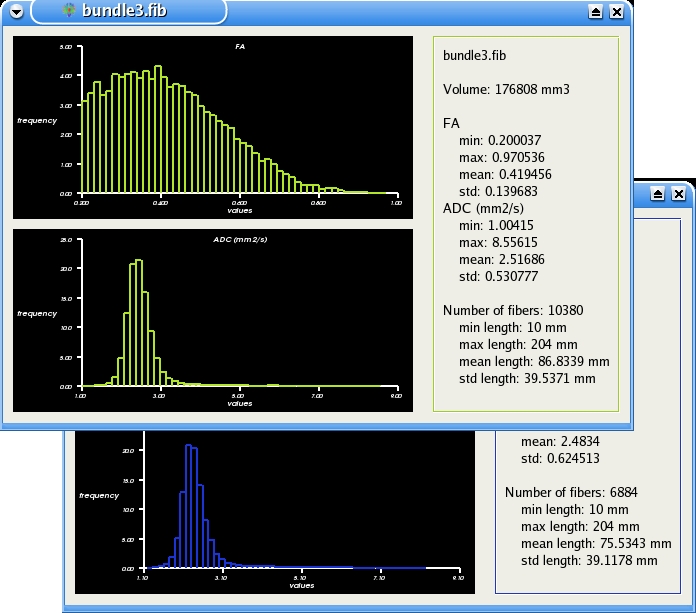
![]() When the fiber manager contains extracted bundles, you can compute statistics on
a specific bundle by clicking ``compute statistics'' button located in the fiber settings
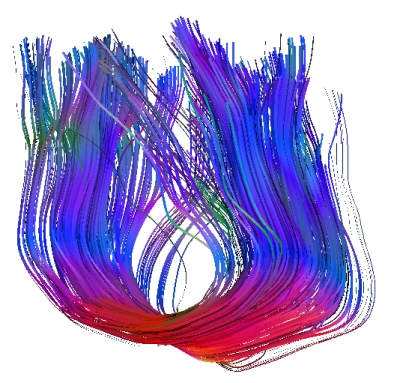
area (see Fig. 3.14, left). It will display histograms of ADC and FA values
of the region covered by the fiber. It will also display statistics on the length of the
fibers (see Fig. 3.16).
When the fiber manager contains extracted bundles, you can compute statistics on
a specific bundle by clicking ``compute statistics'' button located in the fiber settings
area (see Fig. 3.14, left). It will display histograms of ADC and FA values
of the region covered by the fiber. It will also display statistics on the length of the
fibers (see Fig. 3.16).
|
|