![]() We arrive now to the main purpose of DTI analysis : fiber tracking. White matter fiber
bundles are tracked from the tensor field information. You can perform fiber
tracking by clicking ``Track Fibers'' button. The reconstructed fibe are then
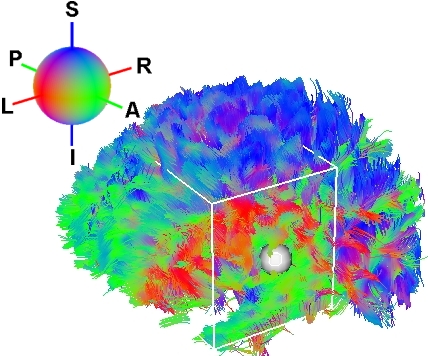
displayed in the 3D view as lines colorized by their direction. As in the FAc map, red
indicates a Left-Right orientation, green an Anterior-Posterior orientation
and blue an Inferior-Superior orientation. In Fig. 3.9 you can see on
the left a group of parameters you can set to optimize tracking. ``FA Threshold''
controls the FA value underwhich fiber tracking will stop (the value
indicated on the slider has to be divided by 1000 to get the real FA
value). ``Smoothness'' controls the smoothness of reconstructed fibers. The
greater the slider value is, the smoother the fibers will be. The next parameter controls the
minimum length of fibers to be valid (in mm). The last parameter is ``sampling''. If the set of
reconstructed fiber tracts is too dense, you can set the sampling to a value greater than
one. For instance if you set ``sampling'' to 4, fiber tracking will be performed onevoxel
out of four. Consequently the process of fiber tracking will be 4 times
faster. The next sections will explain you how to extract a fiber bundle from the set of
reconstructed fibers.
We arrive now to the main purpose of DTI analysis : fiber tracking. White matter fiber
bundles are tracked from the tensor field information. You can perform fiber
tracking by clicking ``Track Fibers'' button. The reconstructed fibe are then
displayed in the 3D view as lines colorized by their direction. As in the FAc map, red
indicates a Left-Right orientation, green an Anterior-Posterior orientation
and blue an Inferior-Superior orientation. In Fig. 3.9 you can see on
the left a group of parameters you can set to optimize tracking. ``FA Threshold''
controls the FA value underwhich fiber tracking will stop (the value
indicated on the slider has to be divided by 1000 to get the real FA
value). ``Smoothness'' controls the smoothness of reconstructed fibers. The
greater the slider value is, the smoother the fibers will be. The next parameter controls the
minimum length of fibers to be valid (in mm). The last parameter is ``sampling''. If the set of
reconstructed fiber tracts is too dense, you can set the sampling to a value greater than
one. For instance if you set ``sampling'' to 4, fiber tracking will be performed onevoxel
out of four. Consequently the process of fiber tracking will be 4 times
faster. The next sections will explain you how to extract a fiber bundle from the set of
reconstructed fibers.
|
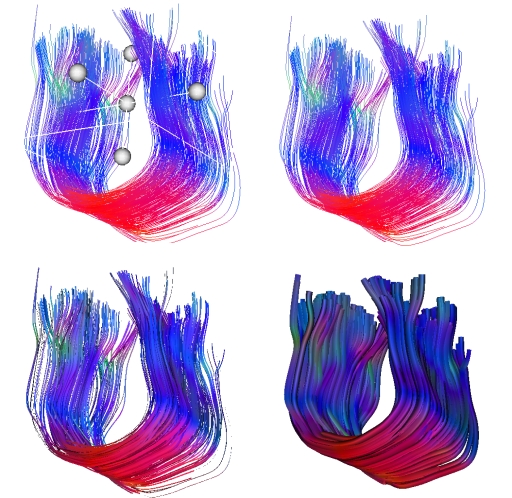
On the Display panel you will see some parameters for fiber visualization (see
Fig. 3.10). Here you can decide to show or hide the fibers and to show or hide
the fiber cropping box (see Sec. 3.5.1). You also can choose between
different visualization modes. Default ``polylines'' are simple lines. ``3D
ribbons'' will represent each fiber as a ribbon. Finally you can
choose ``3D tubes'' and set the tubes' radius (see Fig. 3.10). This last
option takes a lot of resources and may slow down the graphic rendering. Note that these
different modes are for visualization purpose and do not represent any anatomical
reality.

|