See Download page for Download the P2Prec demo
We describe how the P2Prec services cooperate using scenarios based on the Ohsumed documents corpus [6] that has been widely used in IR. It is a set of 348566 references from MEDLINE, the on-line medical information database, consisting of titles or abstracts from 270 medical journals over a five year period (1987-1991). Our application is done as a lightweight application, meaning that no client needs to be downloaded for using it.
In order to couple the P2Prec core, made of OSGi configurations, with the chosen scenarios, we have used the Google Web Toolkit (GWT: http://code.google.com/webtoolkit/) to build User Interface. This toolkit allows defining a client/server application written completely in Java that runs in a web browser. It automatically compiles the Java client code into HTML and JavaScript, and easily permits to use Java libraries. Therefore, all graphical interfaces of this demo are made of web pages and run in a classical browser.
We show how the application works, from the global installation to the utilization by an end-user. Installation. In order to run a P2Prec peer properly, any user (at a peer) has to connect first to the Bootstrap Server (BS). Therefore we define a place the BS will run on. Every peer in the system will know its IP address. As the BS and any peer offer the same kind of services, we have defined two OSGi configurations for running P2Prec components: one as a BS, and one as a standard peer that will connect to the BS.
Initialization. Each peer consists of a LDA part coupled with a Communication part (called P2Prec). As the demonstration starts, the BS is created, and so are several peers (30 of them). Each peer sends some of its documents, which are arbitrarily distributed among all peers, to the BS to perform LDA on a sample of all documents and to define the set of topics used in the network. Next, the BS informs all connected peers about the topics that are present in the network, and each peer indexes its own documents with the set of topics. Each peer is given an initial FOAF, which determines its friends in the network, and provides it information about them. It can now start gossiping with other peers, and the user belonging to the peer can send queries to discover documents. We show by connecting a new peer to the network how he gets initial information what is in its FOAF, in the case it has already joined the network in the past (it knows other peers) and in the case it connects to the network for the first time.
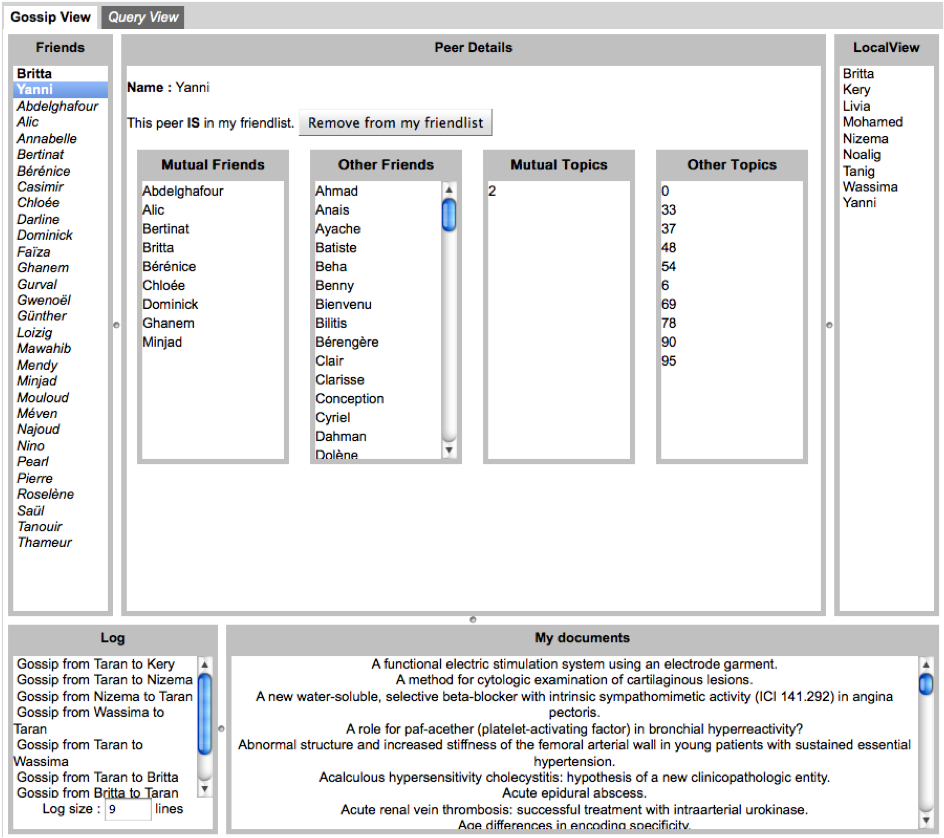
Figure 1: P2Prec Gossip Interface.
Gossiping. The gossip service is at the heart of P2Prec, and is transparent to the end-user. While peers exchange gossiping messages, the system recommends new friendships to users. For the sake of the demonstration, we developed an interface showing what is internally happening during gossiping (see Figure 1). The interface shows the current friends of the user, the gossiping messages sent and received by the peer, the gossip local-view that permits to find friends, etc. We show how the gossip mechanism notifies the user that other users share the same interests, and ask her to add them to her friend list.
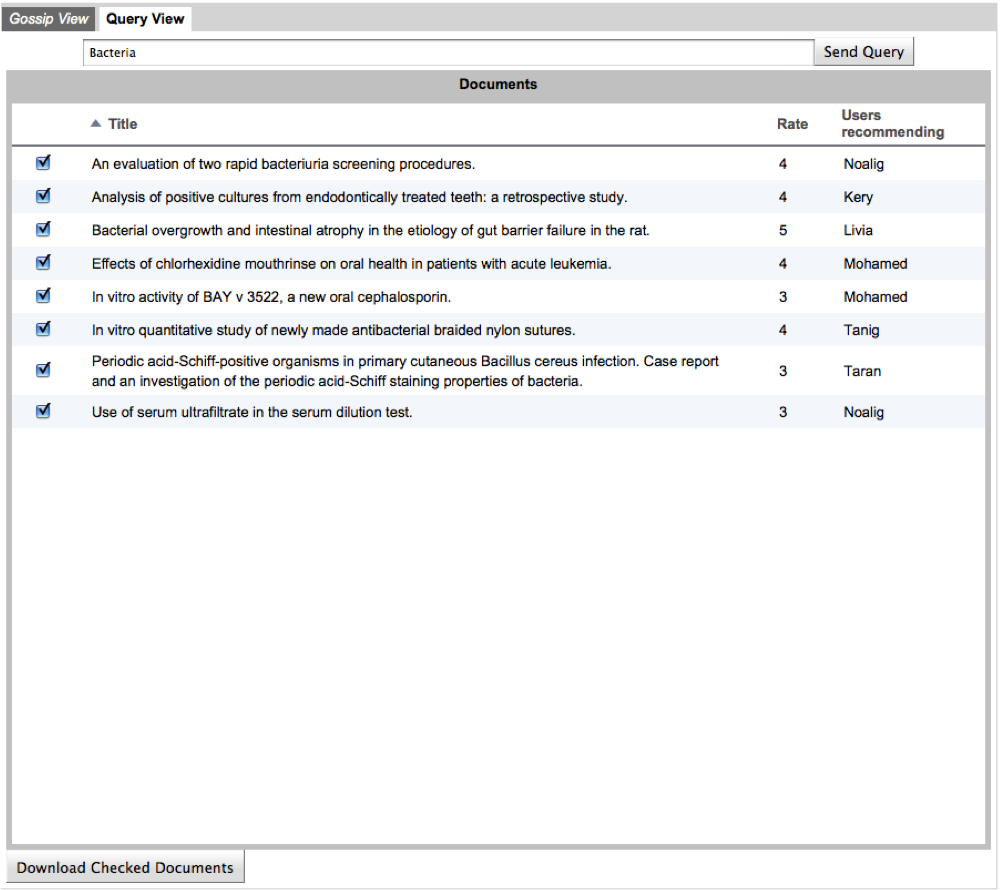
Figure 2: P2Prec Query Interface.
Querying. Spreading information with gossip to make new friends has one aim: being able to answer queries accurately when a user searches for documents. This is where the query service is needed. The user is able to send a query for getting documents recommendations from her friends. The local LDA of the user translates the query into a set of relevant topics, and the peer sends them through the query service to the user’s friends. Each friend may recommend documents depending on the similarity in terms of topics and the rate of the document. The query hops to friends of friends as many times as its TTL allows, the results being returned during the journey. Figure 2 shows the result returned to the user after a query is sent. We show the results of the query for a user who has been in the network for a long time compared to a new user, and compare the accuracy and the number of answers she gets.
We can monitor the connections between the different peers of the network by using the SON's integrated graph view. Figure 3 shows an example of this view during the demo.
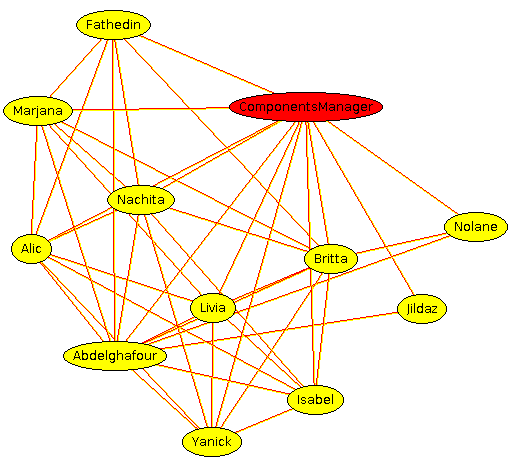
Figure 3: Graph View.
