


Next: the RCS polar representation
Up: How to run the
Previous: How to run the
Contents
Index
- Click on ``cartesian plot'' or ``RCS cartesian plot''. A
working window appears (see figure 1.5) representing by
default the first value plotted.
Each component of this working window is described below.
Figure 1.5:
1D working window: cartesian plot.
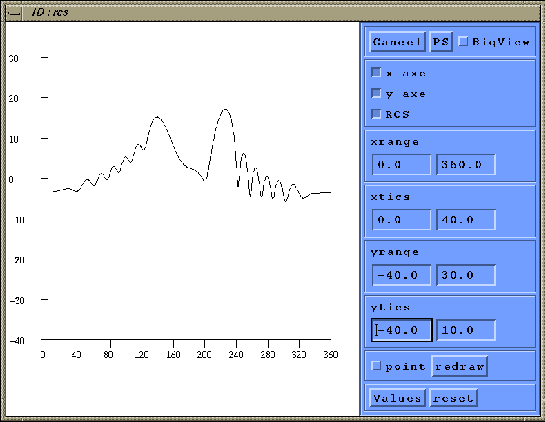 |
- The toggles ``x axe'' and ``y axe'' represent the
axis, while ``RCS is the plotted value.
- To modify the range on the x- y- axis, modify the
``x-, y-range'' values.
Then click on ``redraw'' to validate the new values.
- To modify the first x-, y- axis mark and the increment between
each plotted mark, modify the ``x-, y- tics'' values.
, then ``redraw''.
- To go back to the default ranges and increments, click on
``reset''
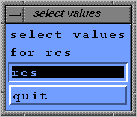
- To change visualizated value, click on ``Value''
.
A selection box appears (see figure 1.6), highlight a value
to draw its representation.
Figure 1.6:
selection box to choose a variable.
 |
- Click on ``point'' in the working window
(a window appears and gives informations about points, see figure
1.7).
Figure 1.7:
information about points.
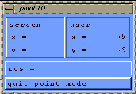 |
- If you want to know the coordinates of a point, keep
the central mouse button pressed (in the drawing area) and look at
the varying coordinates values when moving the mouse.
- If you want to know the value of the selected variable at an x
coordinate, click the left button mouse on the drawing area and look
at the named value (rcs in this example) on the point window.
- You can click on ``BigView'' to
have a big drawing area.
- You can quit the working window by clicking on ``Cancel''
.
Next: the RCS polar representation
Up: How to run the
Previous: How to run the
Contents
Index
Robert Fournier
2002-09-13