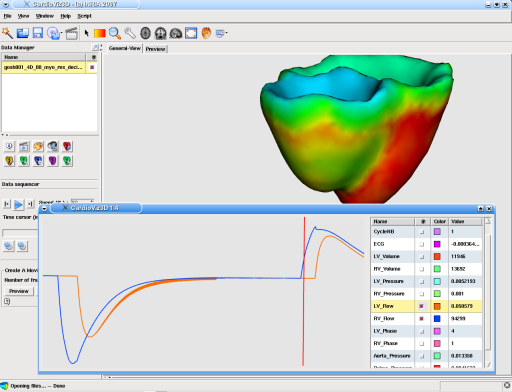
Although this feature is still work in progress, it is now possible to display some global parameters that a time sequence might provide. the file format is simple and will be explained soon. You can easily assign a scalar list to a time sequence, and then follow this scalar along time, while playing the sequence.
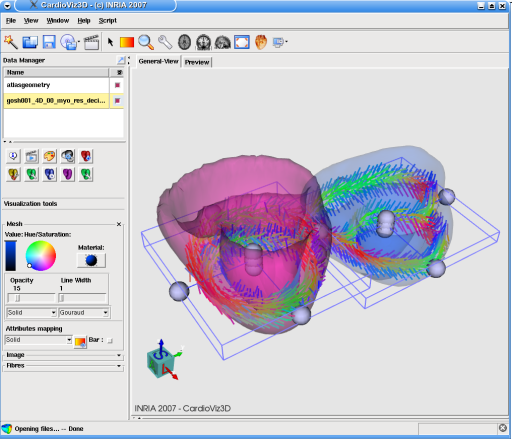
Vector field visualization has been imporved to allow several structures to be displayed in a same view. Again here the data is provided by the statistical atlas of cardiac muscle fibre architecture.
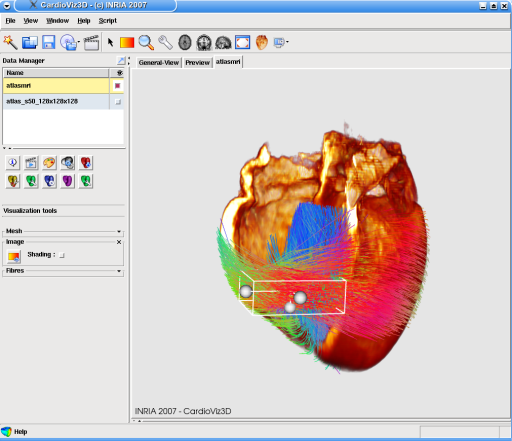
You can now easily visualize and manipulate object such as anatomical fiber field. That is the fibers extracted by a DTI processing too such as MedINRIA. In this example fibers are provided by a statistical atlas of cardiac muscle fibre architecture.
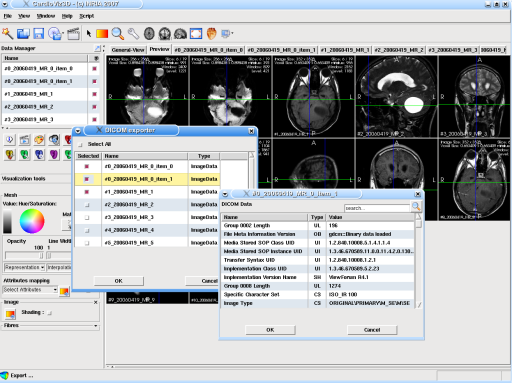
CardioViz3D is now able to write a DICOM exam. From any initial configuration (i.e. weither images have been imported from a DICOM exam or simple files) you can easily write back a DICOM exam containing the images of your choice. You can even edit the information contained in the DICOM files (patient name, etc...)
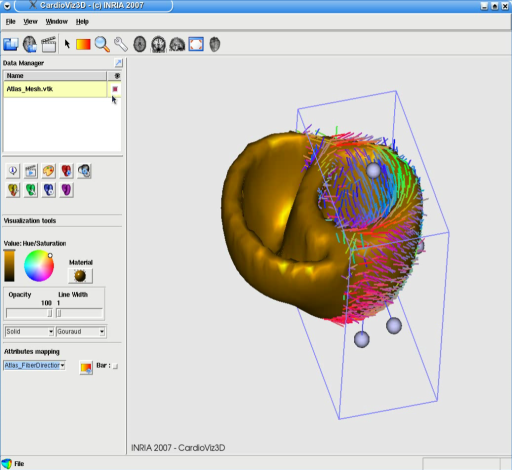
In this screenshot a statistical atlas of the cardiac geometry and fiber directions has been loaded, fiber directions are represented as vectors in each point of the mesh, color coded by there directions. The cropping box (in blue) allows the user to select a Volume Of Interest from this vector field
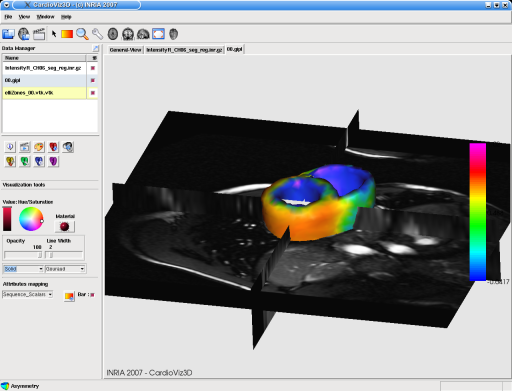
CardioViz3D allows straighforward importation process of multi source data, with the advantage to quickly offer the user a powerfull framework for data visualization and analysis. In this figure an MRI sequence of a beating heart is shown. 4D mecanic and electric modelling of the heart has been preformed to build the displayed mesh, colored with the trans-membrane potential. A tutorial on how to import time sequence of data is available.
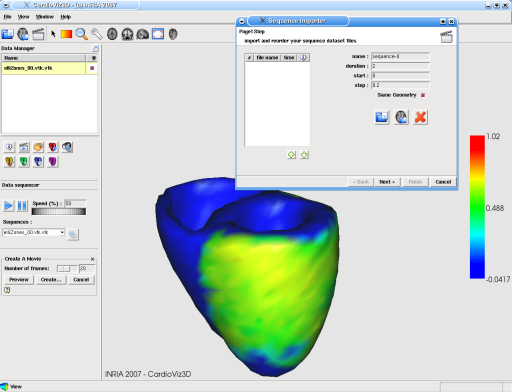
One of the most interesting features of CardioViz3D is the full handling of time sequences of data. Sequences can be imported from a set of files, or they can be created directly from a DICOM exam (for the image case). Either single- or multi- topology mesh sequences are handled. The user can also load and assign 4D scalar (or vector) fields to a sequence, and visualize them in real-time. All mesh visualization features cited above are available for sequence of meshes : color and light effects, scalar color maps, projection, cropping, etc.
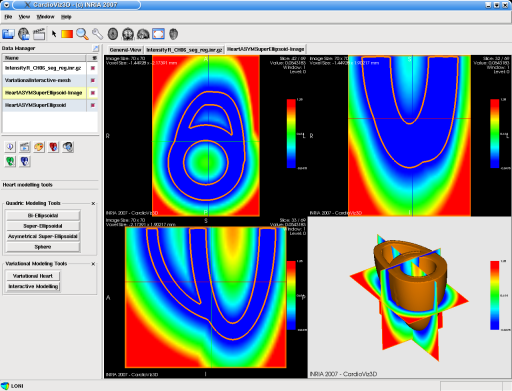
From a set of anatomical parameters of the heart, CardioViz3D can generate a surfacic model that can be used and exported as well. In this figure, an asymetrical super-ellipsoidal model has been generated, the corresponding implicit function is also displayed. The mesh simply corresponds to the 0-level set of the implicit function.
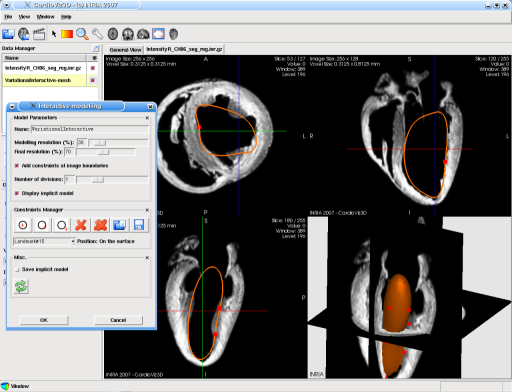
CardioViz3D provides a very intuitive way to generate any surfacic mesh in a few clicks. Using implicit function modelling, the process asks the user for a few points (inside/outside or on the surface mesh) and interactively build the surface upon this information. Resolution of the final mesh can be set. In this figure only 7 surface points have been provided (in addition to a boundary constraint) to build this surfacic mesh. The mesh can be used and exported afterwards for any further process. A tutorial on how to use this feature is available.
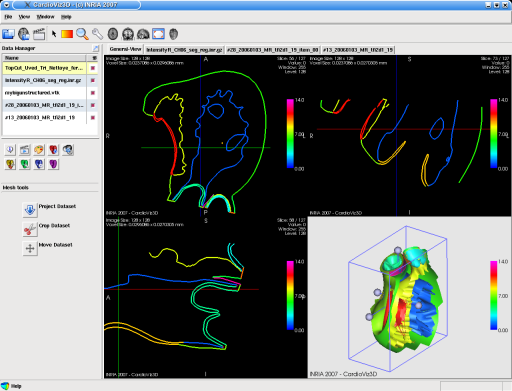
CardioViz3D provides a tool that allow the user to project any volumic or surfacic mesh in the three orthogonal planes. Another tool allow to crop the mesh using a "cropping box", helping to get a better insight of this specific mesh. In this figure the 3D Science's surfacic heart model is shown. Colors come from the division of this model in several zones. The "cropping box" is shown in blue.
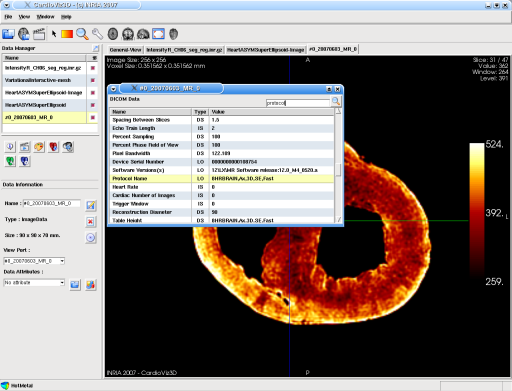
During and after a DICOM exam import, the user can easily access all provided DICOM information through a popup window, very useful to compare characteristics of a set of images.
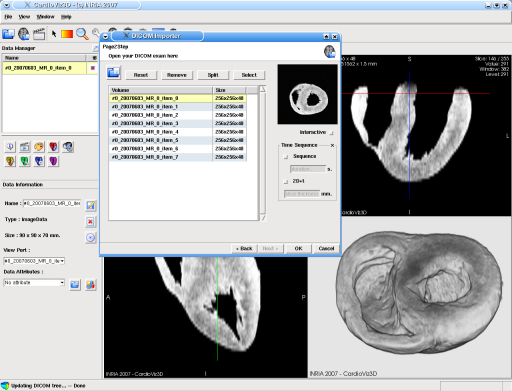
CardioViz3D uses vtkINRIA3D's DICOM import process to read and import DICOM exams, embedded in an intuitive interface. Preview of 3D volume is provided, as well as full DICOM exam information display. The process handles heart sequence import (automatic heart rate detection), as well as 2D+t image set reconstruction.
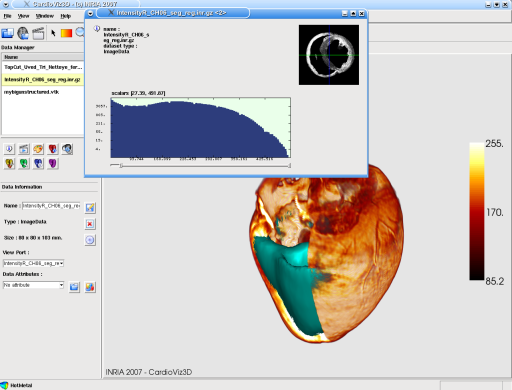
For any type of data CardioViz3D can display information and histograms. For a scalar image for instance (see figure) A histogram of gray values can be shown. If a scalar field is assigned to a specific mesh, the user can display a histogram of the scalar values. Here a heart scalar image is shown in Texture Volume Rendering mode, with its corresponding volumic model mesh (in green). The histogram of the image grey values is shown.
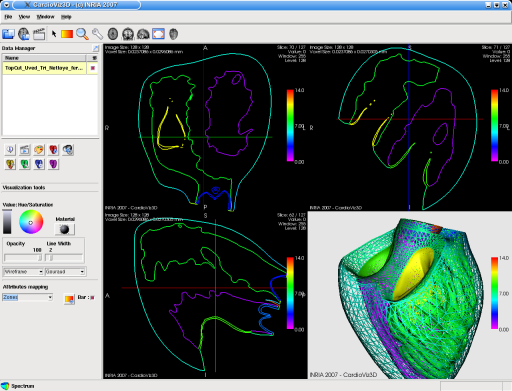
CardioViz3D is also able to read and load surface mesh objects. VTK files and .mesh files are supported, as well as all internal Asclepios mesh formats. Scalar fields, vector fields can be assigned to these meshes and visualized. Surface meshes as well as volume meshes can easily be projected in the three orthogonal planes, a set of parameters allow the user to manage the visualization of the selected mesh (i.e. Light effects, alpha value, interpolation, scalar field color map, ...). In this figure the dataset corresponds to a surface model of the heart, coming from the 3D Science project and is shown in wireframe visualization mode.
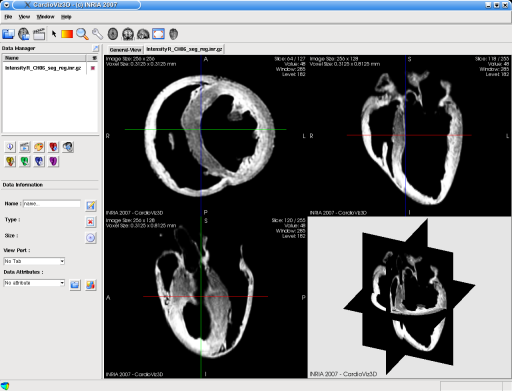
CardioViz3D can be used as a simple and powerfull image viewer, with tab browsing system allowing to visualize a set of 3D images. CardioViz3D handles a lot of image file format (analyze, gipl, DICOM, mha, nii, jpeg, ...). Projections in the three orthogonal planes are shown and synchronized together for intuitive navigation. The color map of the image can easily be changed and a scale-bar can be shown. Volume rendering is provided.