| Previous : Digital Elevation Models | Up : Contents | Next : Urban aera model |
| ||||
|
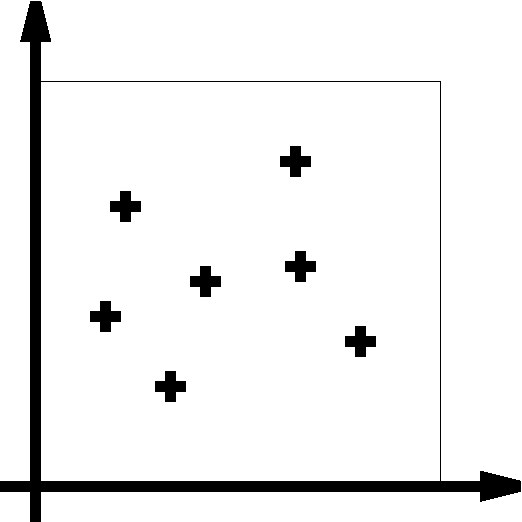
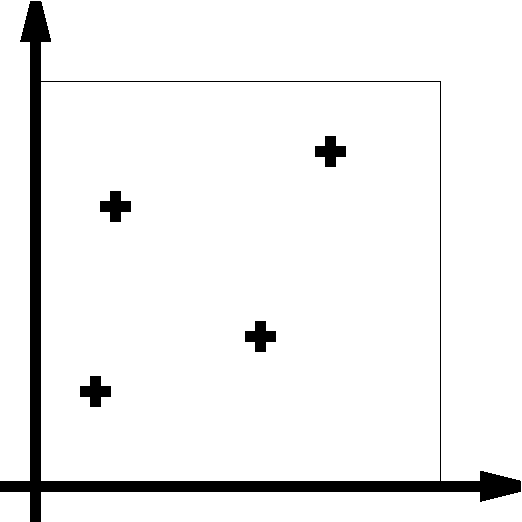
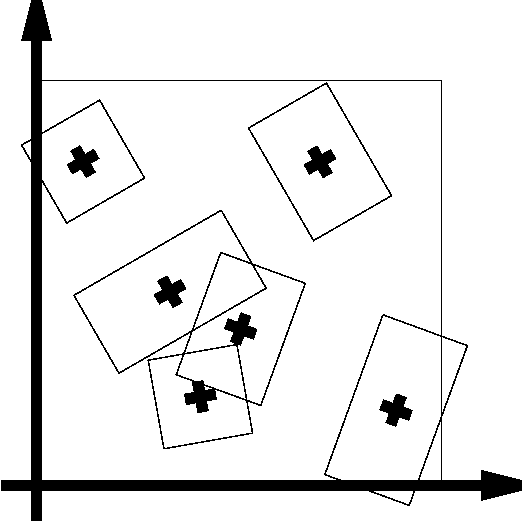
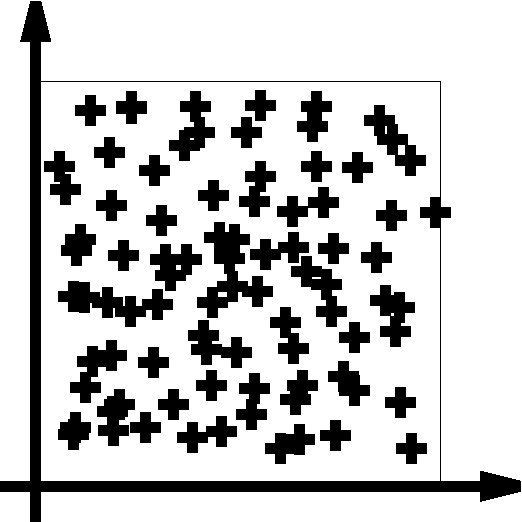
We consider a compact set K. A point process X is defined as a mapping from a probability space to configurations of points of K. Since K is bounded, the conditions ensuring the measurability of such a mapping are verified (see [24] for details) : Figure d) shows some realisations of a point process. Basically, it may be sawn as a random variable giving random configurations of points. The total number of points of a point process is a random variable. |
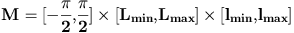
The spaces of interest are :  A point process X is a measurable mapping such that :
  | |||
|
||||
|
Poisson point processes are the basic tool of spatial point
processes theory. They can be defined by the folowing property. We note N(A) the number of point of a point process X falling in the Borel set A .
Poisson point processes allow to define density of point processes. Under some assumptions, (that are verified in our framework), it is possible to deal with point processes whose law is dominated by the distribution of a reference Poisson point process. It is then possible to write the Radon nykodym derivative of this law, ie the density. In our work, this property is used to construct point processes. Given a reference Poisson point process, we built new point processes by defining their density. Moreover, as we shall see later, it is possible to sample such a point process, defined by a density and a reference Poisson point process, using Monte Carlo Markov Chain methods. |
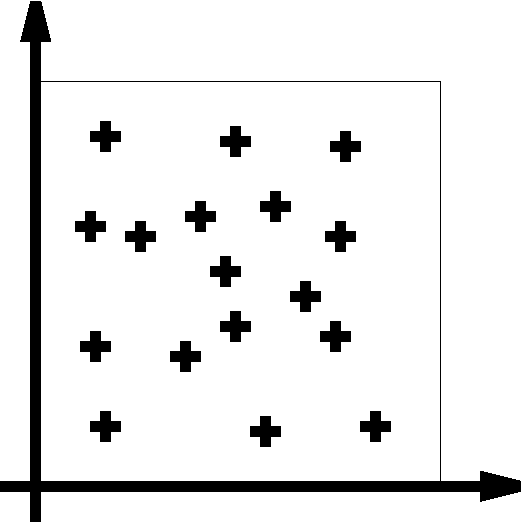
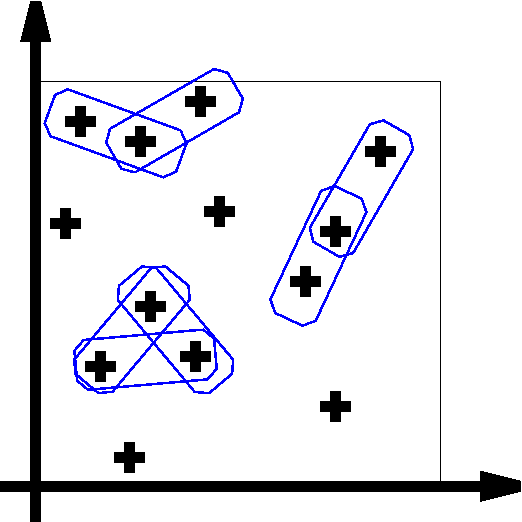
Uniform Poisson point processThe most simple Poisson point process, is the point process with intensity measure being proportional to the Lebesgue measure on K : The mean number of points falling in K is then :  To generate points in K with the distribution of this point process a two step procedure can be used :
This enhance the fundamental properties of the uniform Poisson point process :
| |||
|
||||
|
Our goal is to work with geometrical objects. That means we should not
work with points from K but from S=K*M where M
is the space of marks.
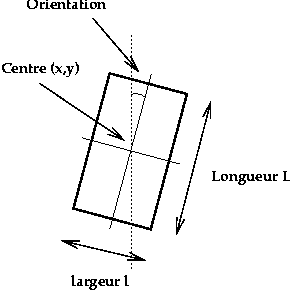
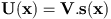
However, we do not use simply a point process on S, but a marked point process whose points are living in K and marks in M. That means, this point process is both a point process on K and a point process on K * M. In our framework, we are interresed by rectangles as show Figures e) and f) and we take the space of marks as it should be to allow to work with rectangles.
The intensity measure of a marked Poisson point process has to be
written as a product between two measures. The first measuring Borel
sets of K and the second measuring Borel sets of M.
From now, we will consider marked Poisson point processes with
intensity measures being the product between the lebesgue measure on
K and some probability measure on M :  |
Figure e) We want to deal with rectangles, so we use the following mark space :
 corresponding to the following parameters.
| |||
|
||||
|
As we saw in the Poisson point process section,
it is possible to define densities of point processes under a
dominating Poisson point process. However, some assumptions have to be made. In our framework, since S is bounded, these assumptions are verified. We denote by pi the distribution of a Poisson point process, with intensity v(.), and by Nf the set of all configurations of points of K.
We consider p a measurable function from Nf
to non negative reals such that : 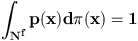
We look at densities under the Gibbs form : 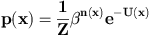 where Z is the normalising constant, U denotes the energy fonction, and beta stands for a scale parameter. We now show two examples.
|
If U=0 we obtain a Poisson point process.
|


| Previous : Digital Elevation Models | Up : Contents | Next : Urban aera model |