Description
Broadly speaking, Machine learning (ML) is the scientific field aiming at building models and inferring knowledge by applying algorithms to data. Therefore, the process involves the (statistical) analysis of data, and the design of models, possibly predictive. These tasks are fundamental ones in modern science in general, biology and medicine in particular. This course will develop an introduction to ML by reviewing the fundamental principles and methods.
In order to guarantee the same theoretical backgroud, frontal lectures will be the same for DS4H, SPECTRUM and LIFE students. Each lecture will be accompanied by a hands-on practical (in Python3), during which LIFE students will work with datasets of biological and/or medical importance. The hybrid nature of this course provides a unique opportunity to assess the performances of the various methods studied (running time, stability, sensitivity to noise/outliers, etc), and to think critically about the quality of models in biology and medicine.
The datasets used during the practicals will cover the main classes of data used in modern biology, at all scales (individual molecules, cells, organs, individuals), and will reference current, real-world problems taken directly from scientific studies.
Close
Outline
The course consists of the following eight lectures (2h + 2h practicals each):
1. Machine Learning: Models and Data
2. Regression with linear models
3. Classification and Logistic Regression
4. Support Vector Machines
5. Bayesian Methods: Naive Bayes and Linear Discriminant Analysis
6. Decision Trees and Random Forests
7. Clustering
8. Dimensionality reduction
Close
Class 1
Machine Learning: Models and Data
Summary
Artificial Intelligence is now part of our day-to-day life, and its range of applications does not seem to stop extending. But how can a computer program learn, and how is machine learning useful for solving vast classes of computational problems? This lecture introduces the fundamental actors in Machine Learning: data and learning algorithms.
- Data:
- Features
- Input and output
- Quantitative vs. qualitative data
- Structured vs. non-structured data
- Algorithms:
- Supervised vs. unsupervised
- Regression vs. classification
- Reduction vs. clustering
- Pipelines
Although formally presented as distinct subjects, one should view these two concept as deeply intertwined, each one strongly affecting the other
An introduction to the main Python packages and Jupyter notebooks is given, along with an exhaustive list of bibliographic references
Practical
The first practical is a Python3 refresher and an introduction to the use of Jupyter notebooks.
Assignment
Close
Class 2
Regression with linear models
Summary
Regression is used every time we want to estimate the relationship between a dependent variable and one or more independent variables (or features). From a ML point of view, we are thus interested in methodologies for predicting a response value from a certain number of input variables.
This lesson will cover linar regression models, and in particular:
- Simple linear prediction and least squares
- Linear regression model
- Least squares criterion
- Model adequacy for simple linear regression
- Mean squared error
- Variance analysis
- Relative criterion
- Residuals analysis
- Finding and handling outliers with leverage analysis
- Multivariate linear regression
- Polynomial trends
- Finding optimal parameters
- Hyperplanes
- Regression in interaction models
- Model adequacy for multivariate linear regression
- MSE and RMSE in multiple dimensions
- Colinearity test
Practical
We will apply the acquired knowledge on linear regression for investigating the relationship between genome length, number of coded proteins, and extension of coding/noncoding parts in a very diverse set of organisms, from animals to bacteria, viruses and considering even mitochondrial genetic material. The student will be guided through progressively more complex analyses, and will have to learn to use the fundamental linear regression methods and efficiently visualize the results.
Jupyter notebook - LIFE
Close
Class 3
Classification and Logistic Regression
Summary
Logistic regression is a class of supervised classification algorithms used to model the probability of an observation to belong to one among a given set of classes. We will explore the following subjects:
- Linear classifiers
- Binary linear classifiers
- Multi-class linear classifiers
- Logistic regression
- The logistic function and its parameters
- Learning and predicting with logistic classifiers
- Nonlinear transformations
- Linear separability
- Kernel methods
- Model adequacy
- Accuracy
- The confusion matrix
- Regularized logistic regression
Practical
During this lesson we will work with one of the traditional AI dataset for medicine applications: the UCI ML Breast Cancer Wisconsin (Diagnostic) dataset. 30 features computed from a digitized image of a fine needle aspirate (FNA) of a breast mass describe characteristics of the cell nuclei present in the image. The aim is to predict whether the cells have benign or malign cancer. The students will have to employ the logistic classificators studied in the course in order to maximize the accuracy of the prediction.
Jupyter notebook - LIFE
Data - LIFE
Close
Class 4
Support Vector Machines
Summary
SVMs are a popular and robust class of models for supervised classification that optimizes the position of hyperplanes in the space of input data so as to divide them in subspaces corresponding to the input classes. The following subjects will be detailed:
- Hard-margin SVM for binary prediction
- Formulation as constrained minimization
- Formulation as convex optimization
- Dual formulation
- Support vector calculation
- Soft-margin SVM for binary prediction
- Convex optimization and dual formulation
- Study of the parameter C
- Nonlinear SVM
- Feature transformation
- Kernels
- Multi-class SVM
Practical
As the techniques studies in the course become more effective, real-world problems become more challenging. In this lesson we will work with data from single cell transcriptomics (SCT), where a set of cells from a blood sample have been analyzed, and are described using a certain number of feactures. Do SVMs manage to tell apart different types of cells?
Jupyter notebook - LIFE
Data - LIFE
Close
Class 5
Bayesian Methods: Naive Bayes and Linear Discriminant Analysis
Summary
Bayesian statistics can be employed for classification purposes as well. The most trivial application is called Naive Bayes classifier, and will be useful for introducing all the main characteristics of Bayesian analysis. Possibly the most fundamental concept to retain is the one of likelihood, both for its importance and its ubiquitous use. We will then also study a more advanced Bayesian algorithm called Linear Discriminiant Analysis, and we will see its points in common with other techniques we encountered.
- Introduction: probabilistic classification
- Naive Bayes
- Conditional probabilities and Bayes theorem
- Maximum a priori rule
- Naive Bayes algorithm
- Examples
- Discrete case: weather conditions for playing tennis
- Continuous case: monitoring the temperature of a system
- Linear Discriminant Analysis
- Case n=1: LDA proof
- Case n=1, L=2
- Case n>1: an example
- Model validation
- Cross-validation
- Hyperparameter optimization
Practical
This lession will use synthetic data generated by the students. The practical will indeed focus not only on applying the two prediction algorithms, rather also on getting familiar with the use of cross-validation testing and hyperparameter optimization. We thus need the data to be as flexible as possible, in order to try these validation techniques in different situations
Jupyter notebook
Close
Class 6
Decision Trees and Random Forests
Summary
Decision tree learning uses a tree data structure in order to classify sample data by probing their features with a sequence of threshold values. It is a very intelligible and simple class of methods, but a single decision tree usually does not provide an accurate enough classification. This lecture will thus also treat random forests, which are collections of differently initialized random trees.
- Decision trees: an example
- Hunt's algorithm
- Tree induction
- Best split
- Split based on nominal attributes
- Split based on ordinal attributes
- Split based on continuous attributes
- How to determine the best split
- Measuring impurity with Gini index
- Stopping criteria
- Practical issues and overfitting
- Random forest
Practicals
During this lesson we will work with another classical dataset for ML applied to biology: the Iris dataset, where different iris specimens of three different iris species must be correctly classified given their sepal and petal length and width. We will train and test a decision tree and a random forest, and calculate the accuracy of the two methods.
Jupyter notebook
Close
Class 7
Clustering
Summary
In a non supervised context, clustering aims at grouping the data in homogeneous groups by minimizing the intra-group variance. This fundamental task is surprisingly challenging due to several difficulties: the (generally) unknown number of clusters, clusters whose boundaries have a complex geometry, dealing with overlapping clusters (due to noise), dealing with high dimensional data, etc. This class will present two main clustering techniques: k-means and hierarchical clustering
- Introduction to unsupervised learning
- K-means
- K-means algorithm
- Elbow method
- Silhouette method
- Advantages and drawbacks
-
- K-medoids
- Hierarchical clustering
- Agglomerative algorithm
- Dendrograms
- Group average
- Ward's method
- Complexity
-
Practical
We will apply clustering methodologies for analyzing the structural differences of membrane proteins, and see whether we can infer something about their classification and their evolutionary history.
Jupyter notebook - LIFE
Data - LIFE
Close
Class 8
Dimensionality reduction
Summary
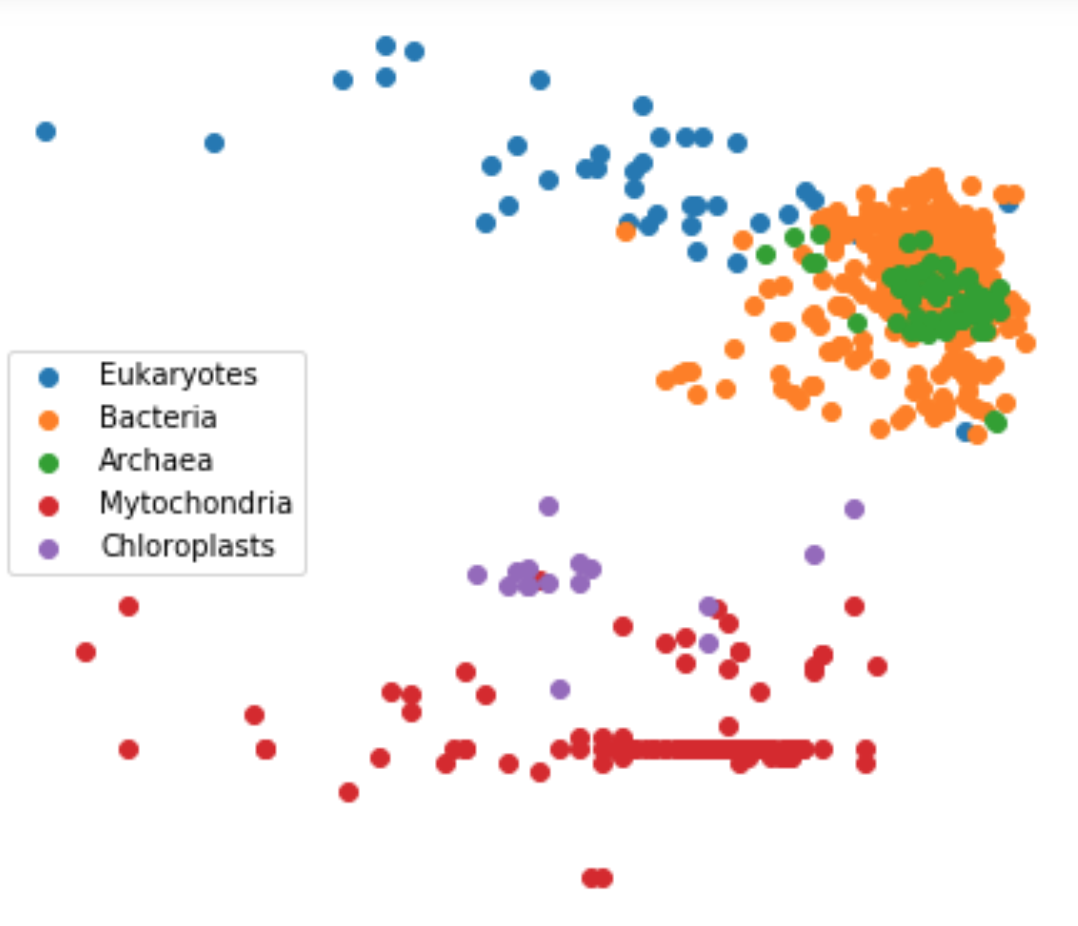
Dimensionality reduction methods aim at embedding high-dimensional data into a lower-dimensional space, while preserving specific properties such as pairwise distances, the data spread, etc. Originating with the celebrated Principal Components Analysis method, recent methods have focused on data located on non linear spaces.
- The curse of dimensionality
- Dimensionality reduction
- Feature extraction
- Principal component analysis
- t-SNE
- LDA for dimensionality reduction
Practical
We will try to do image classification with the help of dimentionality reduction techniques
Jupyter notebook
Close
Location

Close
Validation
Instructions for validating the class will be available later.
Close