The Jitan Environment


[Jitan Home Page] [Java Semantics] [Jitan Environment] [A Detailed Example] [To get the semantics] [Documentation] [Contacts]

The Jitan Environment

We present a development environment for parallel object-oriented programming. It provides visual tools to develop and debug object-oriented programs as well as parallel or concurrent systems. This environment was derived from a structural operational semantics of Java.
The visualization is not obtained from code instrumentation but automatically, using the semantic description. The graphical environment focuses on objects and provides a set of primitives for controlling and probing the execution (execution speed, step-by-step execution, etc). All the updates are made by an incremental method.
The outcome of such an approach is twofold:
  • A pedagogic environment to demonstrate concepts of object-oriented programming, actor computation, and formal semantics.
  • A step towards environments for the formal study of concurrent object-oriented programming.

  • Textual Visualization

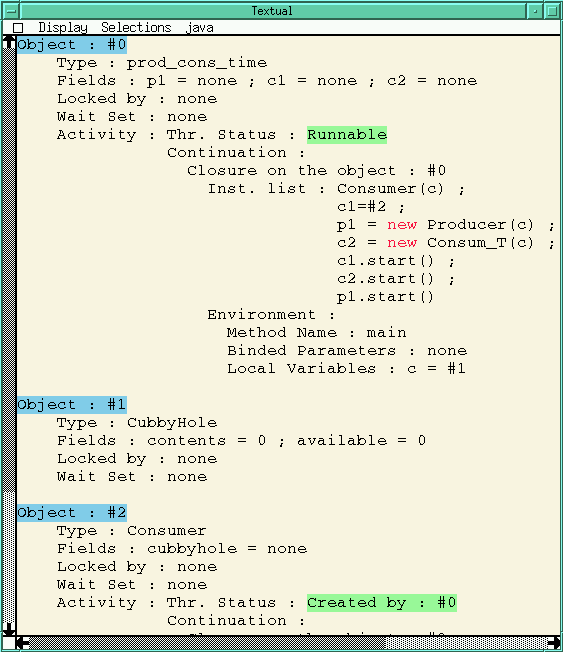
    Our environment provides a window which gives a textual presentation of the current object list during program execution.

    Here is an example which present one step of the execution of the producer-consumer example program.


    In this example, we can see that the identifiers of the objects are in blue. A programmer can know at first sight if the considered object is a thread or not thanks to the thread status which appears in green (e. g. the threads #0 and #2). This window presents the activity of the threads through a continuation and an execution environment, the fields of each object: for example "contents" and "available" which have both the value 0 for the object #1.
    Graphic Visualization

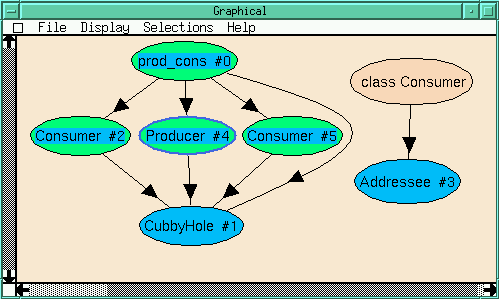
    Our graphical presentation enables the programmer to easily envision the object list topology and its evolution during program execution. It represents the object list using a graph where nodes represent objects and arrows are references between objects.
    Here is an example of the graphic window.


    On this window we can also visualize classes which have static variables: here the Consumer class.

    We can also zoom on an object with the middle button of the mouse in order to examine the field values.
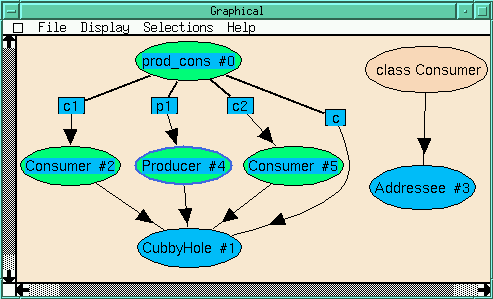


    Of course it is possible to visualize more complex topologies such as on the following picture.
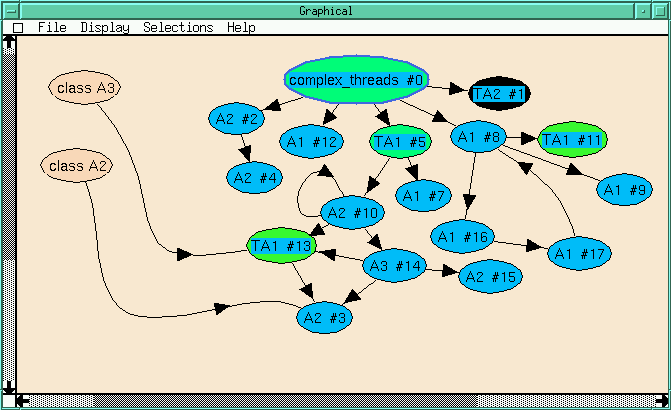

    On this figure you can detect a cycle between the objects #8, #16 and #17, and several DAGs.

    Here is the caption window which presents all color and graphic codes used in our environment.


    These codes are detailed in the Example.

    Summary views

    In current and actual systems, there are many threads, objects, and as such, many complex interactions between them. A solution used to tackle complexity relies on summary views of objects and threads.

    Status Window

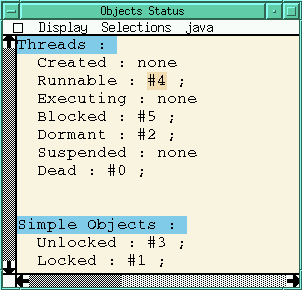
    This window shows the different objects and threads classified by their status. You can see on the following picture an example of this window.


    We can visualize directly that thread #4 is "runnable", thread #5 is "blocked", thread #2 is "dormant", thread #0 is "dead", object #3 is "unlocked", and object #1 is "locked".
    The Thread and Object Interaction Window

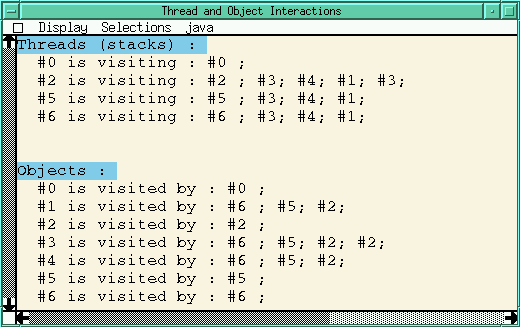
    A succession of method calls on a same object or a cycle in the method calls may be an important information in order to understand or to debug a program. The following window presents a summary of the thread stacks and the object activations.


    On top of the window, the programmer can visualize on which object each thread is currently working and through which objects it has got this reference (and the chain of dynamic calls). For example we can see that thread #2 is executing a method on object 3 and within this method, the thread executes another method call on object #4 then on object #1 and on the object #3 again. This represents an indirect method call.

    A crucial problem when writing concurrent applications is to know where synchronizations have to be placed. It is therefore very useful to figure out concurrent accesses to objects. For each object of the system, including threads, our environment gives all the threads that are currently accessing it. The lower part of the above window exhibits that the object #3 is currently accessed by the threads #6, #5, and #2.


    [Jitan Home Page] [Java Semantics] [Jitan Environment] [A Detailed Example] [To get the semantics] [Documentation] [Contacts]

    Since April, 16, 1998, you are our    th   visitor.
    Thanks for visiting!