Next: Marked Point
Processes
Up: Galaxy filament
detection using
Previous: Galaxy
filament detection using
Introduction
Beyond three hundred billion light-years, when averaged over 100 Mpc,
the visible cosmos can be seen as a gas of galaxies, uniformly
distributed. At smaller spatial scales, astronomical observations as
well as numerical simulations have shown that the repartition of the
luminous matter in the Universe is not so homogeneous. Galaxies cluster
within elongated large-scale structures, called filaments, and leave
huge voids between those filaments. These filaments, which might only
occupy 10% of the volume of the Universe, are organized in a complex
three dimensional network often described as leading to a sponge-like
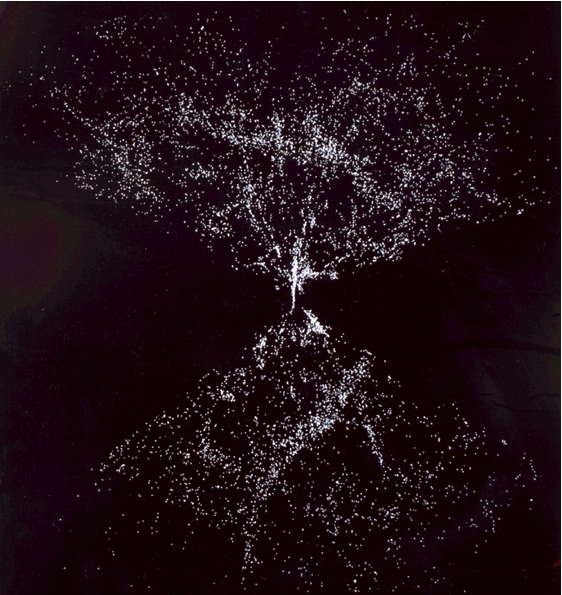
or cell-like 3D topology. As shown in figure 1,
such a filament is not a single structure with sharp edges, but instead
a fuzzy set of points more or less scattered, which makes its detection
difficult. Another difficulty in the detection process comes from the
difference of spatial scales between sparse and prominent compact
features. The gradual disappearance of structures with increasing
distance results from the use of a magnitude-limited sample. The
apparent luminosity of any object is fainter as distance increases, and
only the few galaxies with the highest intrinsic luminosity are then
included.
Up to now, there are only a few methods to extract the filamentary
structure. The Minimal Spanning Tree (MST) method, firstly formalized
by [1] has been then mostly
used [2]. Recently, a method based
on the ``Candy'' model [3]
showed interesting results for the filament detection from a
cosmological simulation [4]. In
section 4.1, a comparison of our
detection result with the MST and ``Candy'' detection results is
presented.
As the ``Candy'' model has been successfully adapted to extract
cosmic filaments, we proposed to use the ``Quality Candy'' model [5] for the same
application. Both models are based on a marked point process approach,
whose efficacity has been shown for road network extraction in remote
sensing [3,5]. Marked point processes
are shortly described in section 2.
The proposed detection model is presented in section 3 and tests on 2-D galaxy maps are
then shown in section 4.
Figure 1:
Three dimensional view of galaxies up to 500 billion light-years, from
the two CfA observation cones (credits: Center for Astrophysics,
Harvard).
|
.
Next: Marked Point
Processes
Up: Galaxy filament
detection using
Previous: Galaxy
filament detection using
Xavier Descombes
2005-10-24