- not so Frequently Asked Questions -
update 2004/9/16
|
|
- not so Frequently Asked Questions - update 2004/9/16
|
|
not so FAQ |
図を描いたその後は...(その1)作ったグラフをTeXの文書に貼り込みたい.gnuplotのドライバにはlatexというのがあり,これを使えばグラフを PicTeXにして出力してくれます.しかし,この方法は描く図によっては表示す る点の数が非常に多くなる場合があり,TeXの処理がメモリ不足で出来なくな ることがあります.従って,TeXに図を取り込む場合は,図をEPSで出力してお いて,LaTeXのgraphicsパッケージで読み込む方が簡単です. まず,gnuplotで図をプロットし,出力ドライバをenhanced EPSにして, EPSのファイルを作っておきます. gnuplot> set term postscript eps enhanced gnuplot> set output "test.eps" gnuplot> set key left top gnuplot> set size 0.5,0.5 gnuplot> set xrange [0:4] gnuplot> set yrange [0:4] gnuplot> set xlabel "Energy [MeV]" gnuplot> set ylabel "Cross Section [b]" gnuplot> set linestyle 1 lt 1 gnuplot> set linestyle 2 lt 1 pt 7 gnuplot> # for gnuplot ver.4 gnuplot> # set style line 1 lt 1 gnuplot> # set style line 2 lt 1 pt 7 gnuplot> plot 0.2536*x+1.1717 title "LESQ fit" \ > with lines linestyle 1,\ > "test.dat" usi 1:2:3 title "data" \ > with yerrorbars linestyle 2 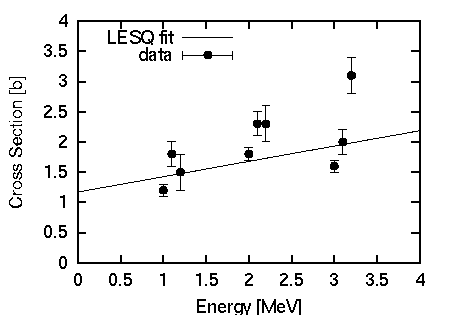
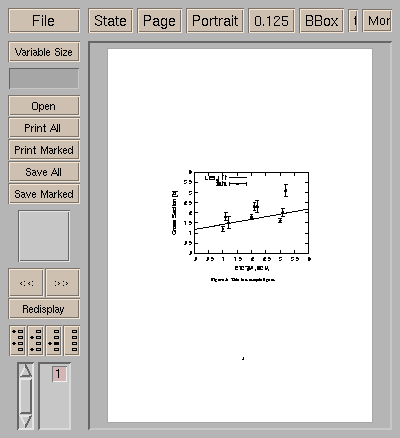
標準のままでEPSを作ると,図に比べて文字が小さくなりすぎてしまいま す. set term のオプションで大きめのフォントを指定するか,この 例の様に set size で全体を小さくしてしまいます.フォントの大き さは変わらないので,相対的に文字が大きくなります. 誤差棒付きの記号を描く場合,gnuplotのPostScriptドライバは,線種を1以 外にすると破線や点線で誤差棒を描いてしまいます.従って,実線で種々 の記号を描くには,linestyleを使い,lt(線種)には1 番(実線)を指定した上でpt(記号)の番号を変えます. TeX(LaTeX2e)に図を貼り込むには,graphicsパッケージを使います.図を任 意の位置に挿入するには,\includegraphics{ EPS file }を使います.EPS fileの所にEPSのファイル名を指定し ます.挿入時に,\resizebox{X size}{Y size}を 使って図全体を拡大縮小することができます.図の縦横の比率を変えずに リサイズするには,X,Y sizeのどちらかに!を指定します.次の例は, figure環境に図を入れてキャプションを付けた場合です.図の横幅を120mm にしています.
\documentclass{article}
\usepackage{graphics}
\begin{document}
\begin{figure}
\begin{center}
\resizebox{120mm}{!}{\includegraphics{test.eps}}
\caption{This is a sample figure.}
\label{test}
\end{center}
\end{figure}
\end{document}
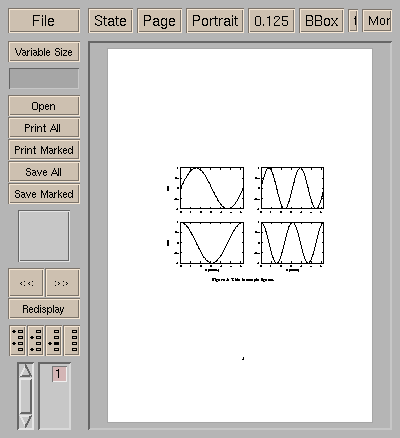
  複数の図をまとめて一つにしたい.複数の図をまとめるには,gnuplot の multiplotを使う方法や複数のEPS を作っておいてそれらを再配置する方法等が考えられますが,EPSをたくさん 作っておいて,LaTeXのtabular環境で整列させる方法が簡単でしょう. 2行2列の計 4枚の図を配置する場合を考えましょう.Y軸のラベルは, 4枚の内の左側にある図だけに付け,X軸のラベルは下側にある図だけに 付けるとします.また,4枚全体に対して一つのキャプションを付けます. まず,4つそれぞれの図のEPSファイルを作っておきます.このとき, X軸とY軸がかならず揃うようにするため, 図の大きさが一定になるようにします. 例として,y=sin(x), cos(x), sin(2x), cos(2x)のグラフを描いてみます. gnuplot> set term postscript eps enhanced gnuplot> set lmargin 5 gnuplot> set bmargin 3 gnuplot> set rmargin 2 gnuplot> set tmargin 2 gnuplot> set size 0.5,0.5 gnuplot> set xrange [0:2*pi] gnuplot> set yrange [-1:1] gnuplot> set output "test1.eps" gnuplot> set xlabel "" gnuplot> set ylabel "sin x" gnuplot> plot sin(x) notitle gnuplot> set output "test2.eps" gnuplot> set xlabel "" gnuplot> set ylabel "" gnuplot> plot sin(2*x) notitle gnuplot> set output "test3.eps" gnuplot> set xlabel "X [nodim.]" gnuplot> set ylabel "cos x" gnuplot> plot cos(x) notitle gnuplot> set output "test4.eps" gnuplot> set xlabel "X [nodim.]" gnuplot> set ylabel "" gnuplot> plot cos(2*x) notitle これらtabular環境に取り込んで,整列させます.
\documentclass{article}
\usepackage{graphics}
\begin{document}
\begin{figure}
\begin{center}
\begin{tabular}{cc}
\resizebox{60mm}{!}{\includegraphics{test1.eps}} &
\resizebox{60mm}{!}{\includegraphics{test2.eps}} \\
\resizebox{60mm}{!}{\includegraphics{test3.eps}} &
\resizebox{60mm}{!}{\includegraphics{test4.eps}} \\
\end{tabular}
\caption{This is sample figures.}
\label{test4}
\end{center}
\end{figure}
\end{document}
 figure環境にせず,単純にtabularで配置した後,そのページだけをdvipsで PostScriptにしてしまえば,一つのPSにまとめることも可能です.これには, dvipsのコマンドラインオプション -pp を使います.また, -E オプションを使って,グラフのある部分だけを切り取ってEPSにすること もできます.この方法は案外便利で,任意の数のグラフを,TeXを使って好き なように配置し,それらをひとまとめにしたEPSを作れます.詳しくはdvipsの マニュアルを参照してください. この他にも,tgifを使って,複数のプロットを一つにまとめる方法もあり ます.また,EPSを読み込めるDraw系のソフトを使って図を並べる手もありま す. |