The first experiment was simply performed by using our surgery simulator with one of the three extrapolation schemes activated. The constant extrapolation gives us the sensation of touching a rough surface. The extrapolation according to time is an improvement, but we sometimes face to unexpected large forces. As soon as the tool movement is slow enough, the sensation given by the extrapolation over position are smooth. Of course, this is a very biased evaluation, and we tried to compare the three methods more objectively.
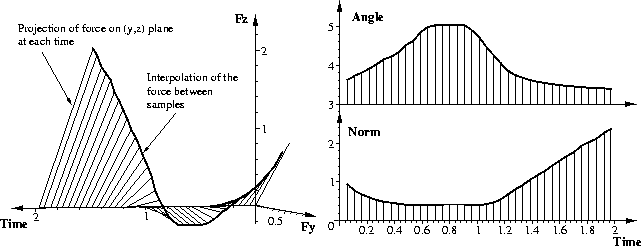
We produced this reference force by linearly interpolating the forces computed by the simulation. This is shown in figure 3. Impulses represent the input forces, the line shows the interpolation. For an easier understanding of the shown figures, we plot 2D experiments. We also prefer a polar representation of the forces (right isde of the figure 3).
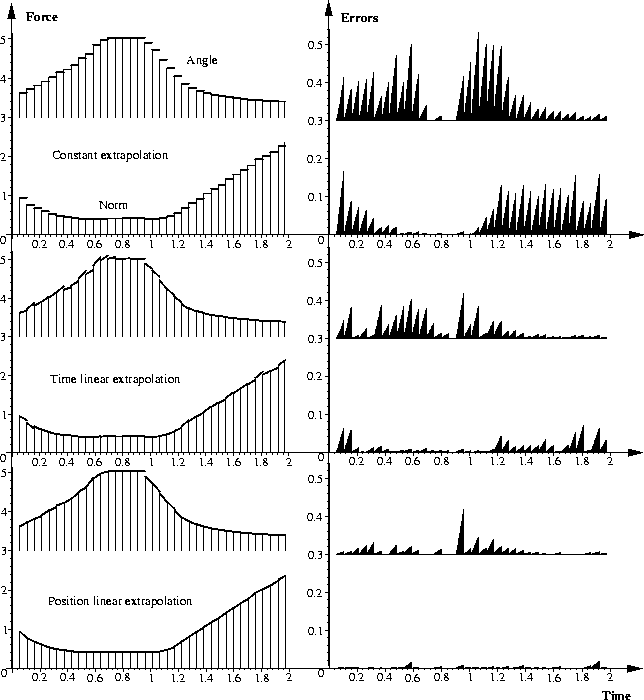
The left column shows the original data set with impulses and the extrapolated one with a line. These plots are compared to the reference one in figure 3. The difference between the extrapolated and the interpolated forces, which is taken as a measure of the error, is plotted, also in a polar fashion, in the right column of the figure 4. Theses plots shows the extrapolation results for a input data set at 20Hz.
We can note that the linear extrapolation over
position gives very interesting results (very few discontinuities and
no singular force). We tried the same kind of experiment with different
simulation frequencies and with
different tool movement. The position linear extrapolation
always gave the best results, which is confirmed by sensation received during
utilization.
Other tests were performed with different speeds for the tool movement.
They show that for a high speed tool movement or for a too weakly sampled
movement (too low simulation frequency), the error becomes important.
An important feature to get a good quality force feedback is the sampling of
the movement. When the sampling is too sparse, the assumption that the tool
follows a linear path is no longer hold.
In order to complete our study, we have also performed a long simulation experience (several minutes) on our liver mesh. During this experiment, the simulation loop ran at about 30Hz. Some statistical data was computed on this experiment, including the tool speed. This time we only consider the norm error. This allows us to give the errors on the applied forces as a percentage of the interpolated force. Results are given in the following table:
| Average speed | 0.017 ms-1 | ||
| Max speed | 0.078 ms-1 | ||
| Frequency | 33 Hz | ||
| Spatial sampling | 0.5 mm | ||
| method | average error | maximal error | maximal force |
| constant | 1.1 % | 56 % | 133 % |
| linear in time | 0.3 % | 9 % | 109 % |
| linear in position | 0.1 % | 7 % | 106 % |
This experiment confirms the precision of the linear extrapolation over position and the importance of the spatial sampling of the movement. Studies have shown that the surgeon's gesture is performed at about 0.01 m.s-1. With such a speed and a simulation running at a visual real-time rate (about 20Hz), the linear extrapolation over position gives very good results.