| [ < ] | [ > ] | [ << ] | [ Up ] | [ >> ] | [Top] | [Contents] | [Index] | [ ? ] |
The Graphical User Interface (abbr. User Interface or UI) is a view of the Supervisor. The UI may be started and stopped at any time without effects on the rest of the system (i.e. it is not needed for the control loop to run).
| 9.1 User Interface Features | ||
| 9.2 Synoptic View | ||
| 9.3 Plot Tabs | ||
| 9.4 Set Point Tabs | ||
| 9.5 Controller Tabs | ||
| 9.6 Saving and Restoring the User Interface State |
| [ < ] | [ > ] | [ << ] | [ Up ] | [ >> ] | [Top] | [Contents] | [Index] | [ ? ] |
The User Interface provides the following features:
| [ < ] | [ > ] | [ << ] | [ Up ] | [ >> ] | [Top] | [Contents] | [Index] | [ ? ] |
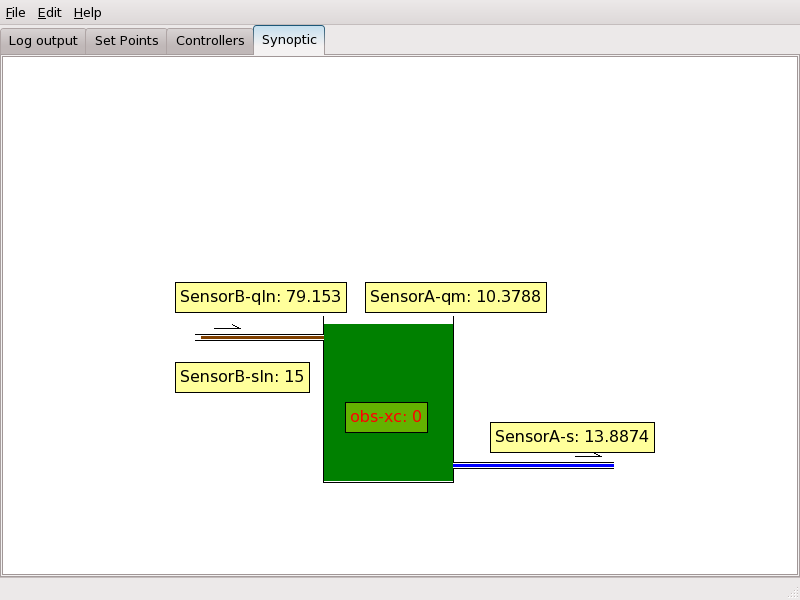
The Synoptic View reports the latest data from the system. It has no user interaction to speak of.
| [ < ] | [ > ] | [ << ] | [ Up ] | [ >> ] | [Top] | [Contents] | [Index] | [ ? ] |
Plot tabs show a chronological view of one or more Variables (a tab can show at most four panes of three variables, and there is an unlimited number of tabs available).
| 9.3.1 Creating a new plot tab | ||
| 9.3.2 Moving inside the tab | ||
| 9.3.3 Manual zoom | ||
| 9.3.4 The Ruler |
| [ < ] | [ > ] | [ << ] | [ Up ] | [ >> ] | [Top] | [Contents] | [Index] | [ ? ] |
To create a new plot tab, select “New Page” in the “Edit” menu. This will show the plot page creation dialog.

The name field contains the name that will appear in the tab bar.
The layout chooser contains the plot layout options: 1x1, 2x1, 3x1, 2x2.
The pane on the right contains all available data sources. Drag a data source to one of the plot items on the left (with a black background) to plot it.
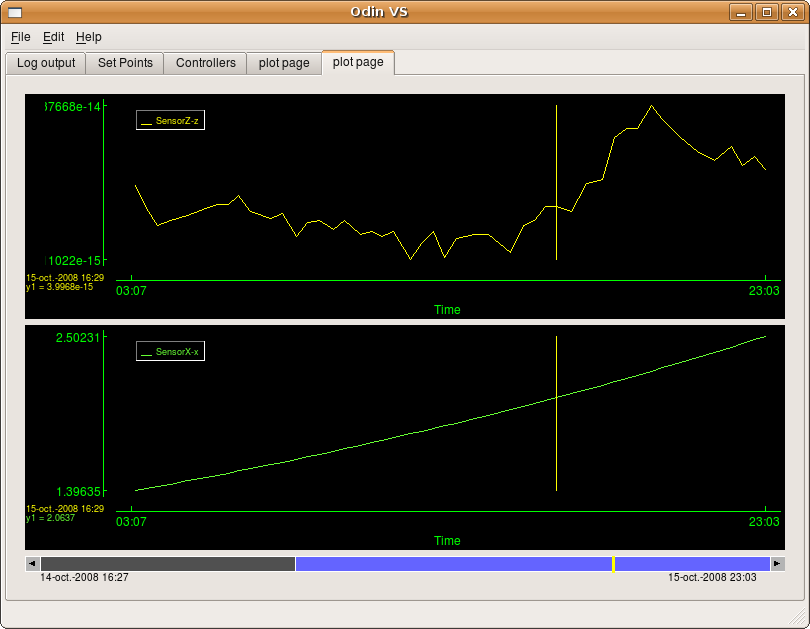
Plots within a tab can be either synchronized or independant. “Synchronized” means that there will be one “time picker” widget at the bottom of the pane that will control the x-zooming, while “independant” means that each plot within the pane will get its own x-zooming widget. This is illustrated by the pictures below:
Independant plot panes:
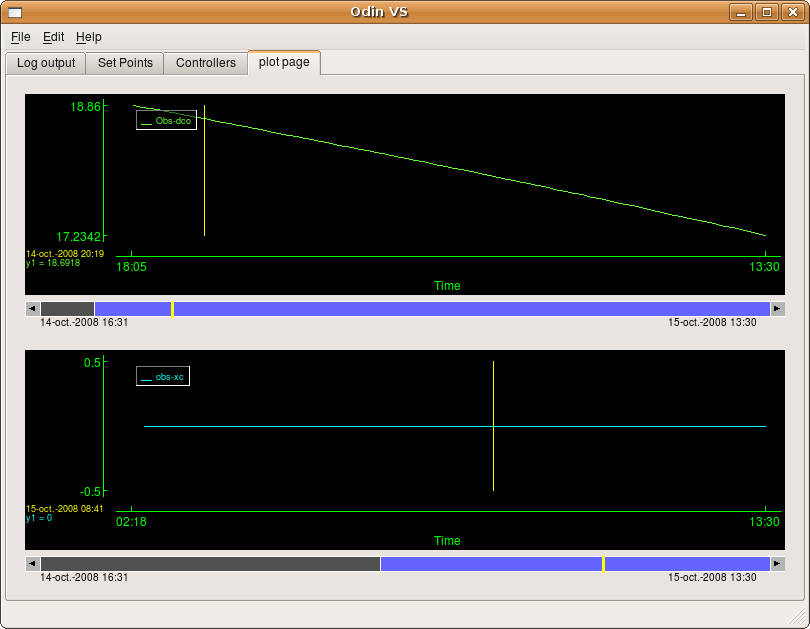
Synchronized plot panes:
| [ < ] | [ > ] | [ << ] | [ Up ] | [ >> ] | [Top] | [Contents] | [Index] | [ ? ] |
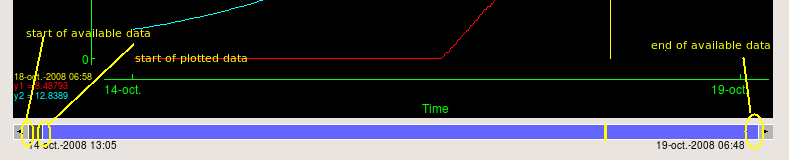
Choosing the time region that is displayed by the pane is done using the x-zooming widget. This widget is illustrated below:
| [ < ] | [ > ] | [ << ] | [ Up ] | [ >> ] | [Top] | [Contents] | [Index] | [ ? ] |
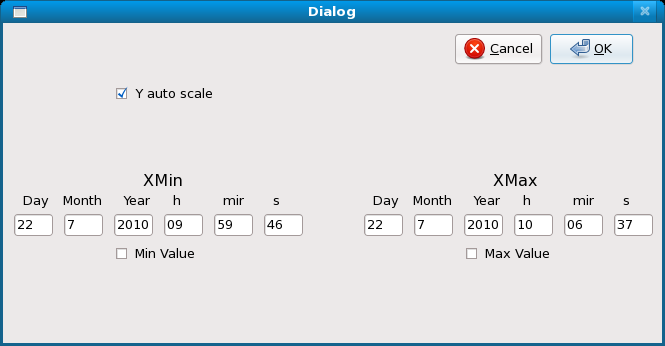
It is possible to manually set the X and Y limits with a right clic on a graph, a window pops up. The widget is illustrated below:
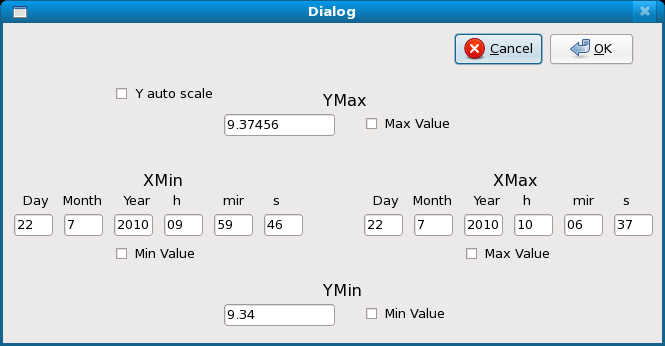
When unselecting “Y auto scale” you can manually set the Y limits. The widget is illustrated below:
| [ < ] | [ > ] | [ << ] | [ Up ] | [ >> ] | [Top] | [Contents] | [Index] | [ ? ] |
| [ < ] | [ > ] | [ << ] | [ Up ] | [ >> ] | [Top] | [Contents] | [Index] | [ ? ] |
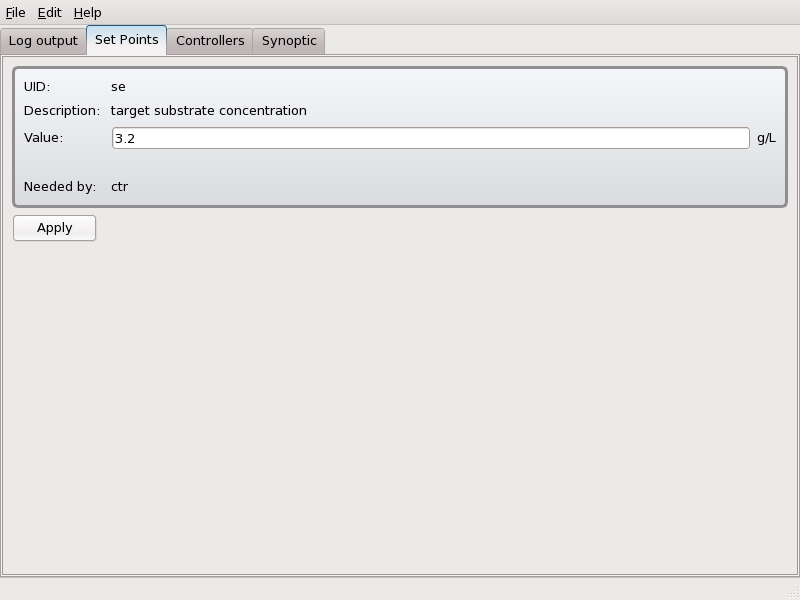
In this tab you can see all the set points used in the system. For each set points all the caracteristics are displayed and you can modify the value if you want, then click on Apply to make it efficient.
| [ < ] | [ > ] | [ << ] | [ Up ] | [ >> ] | [Top] | [Contents] | [Index] | [ ? ] |
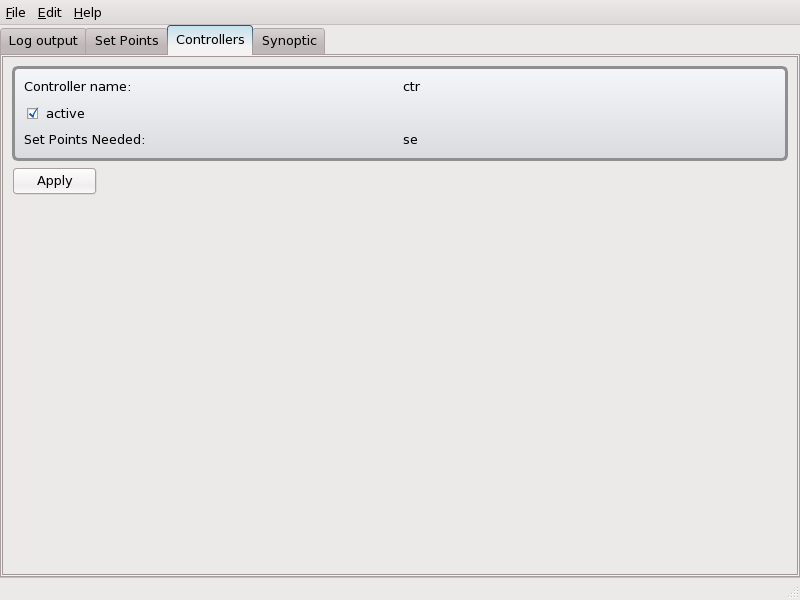
The controller tab shows the controllers that are declared on the supervisor with the caracteristics of each one. You can choose fo each one to activate it or not by selecting or not the 'Activate' checkbox.
| [ < ] | [ > ] | [ << ] | [ Up ] | [ >> ] | [Top] | [Contents] | [Index] | [ ? ] |
Save and restore capability is usefull for saving the plot tabs you defined and the path of used supervisor.ref file.
The fonctionnality is accessible in File menu -> Save/Load.
| [ << ] | [ >> ] | [Top] | [Contents] | [Index] | [ ? ] |
This document was generated by Fabien Dilet on July, 22 2010 using texi2html 1.78.