| Previous : Algorithm | Up : Contents | Next : Conclusion |
|
||
|
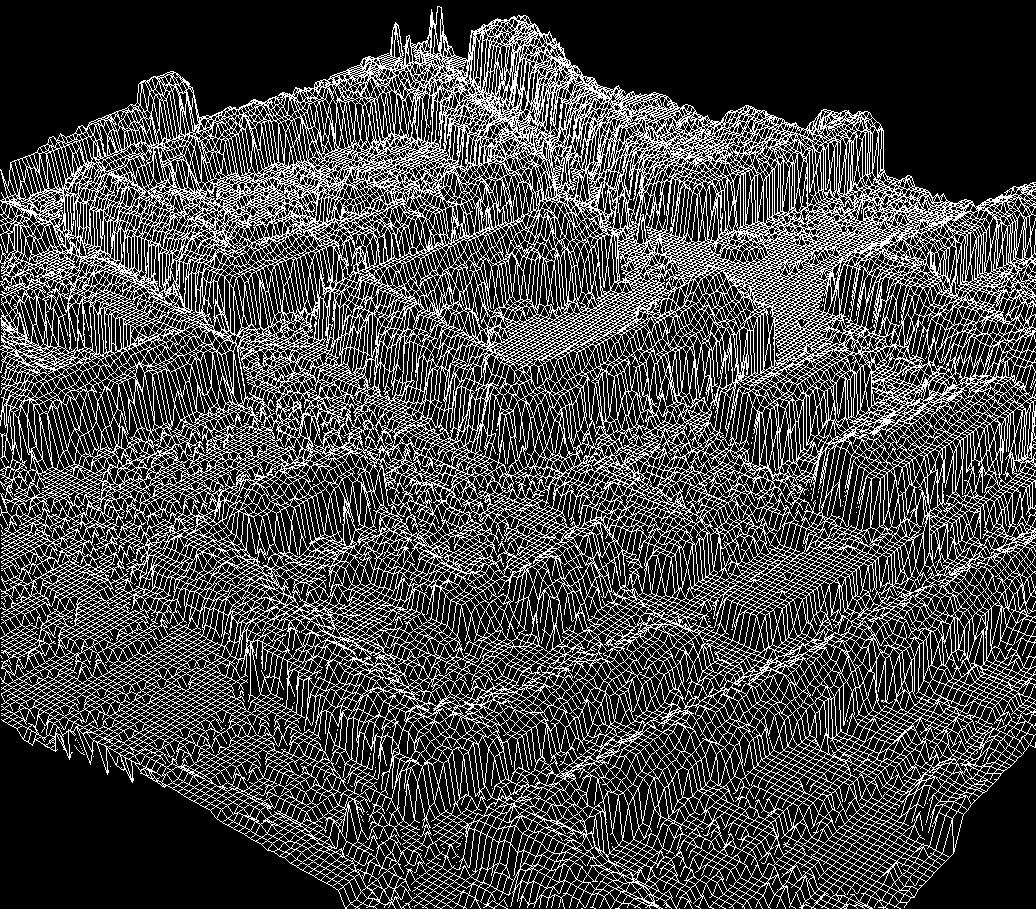
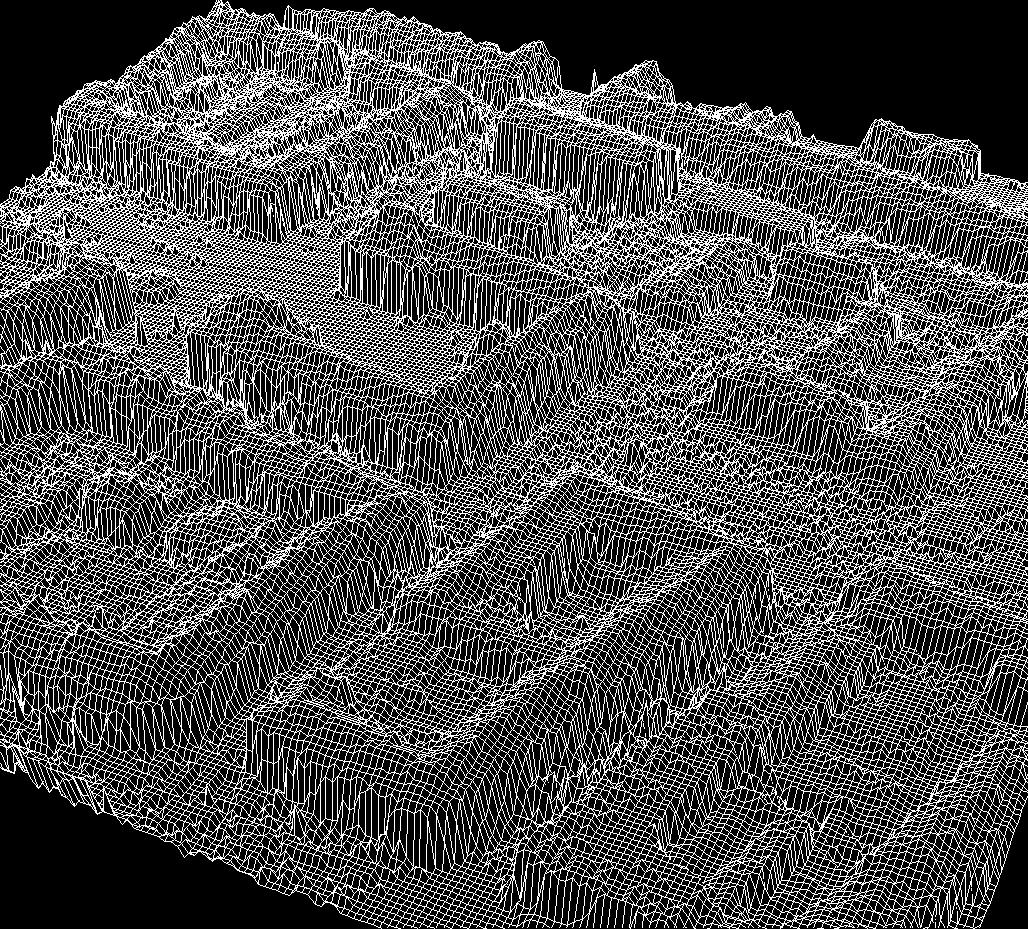
We present here a result obtained on a part of the DEM of the city of
Amiens (France).
Here, small intersections are allowed, for 3D visualization
reasons. The proposed algorithm gives a list of buildings in a text file. Figure l) shows the result of the detection a few comments can be made :
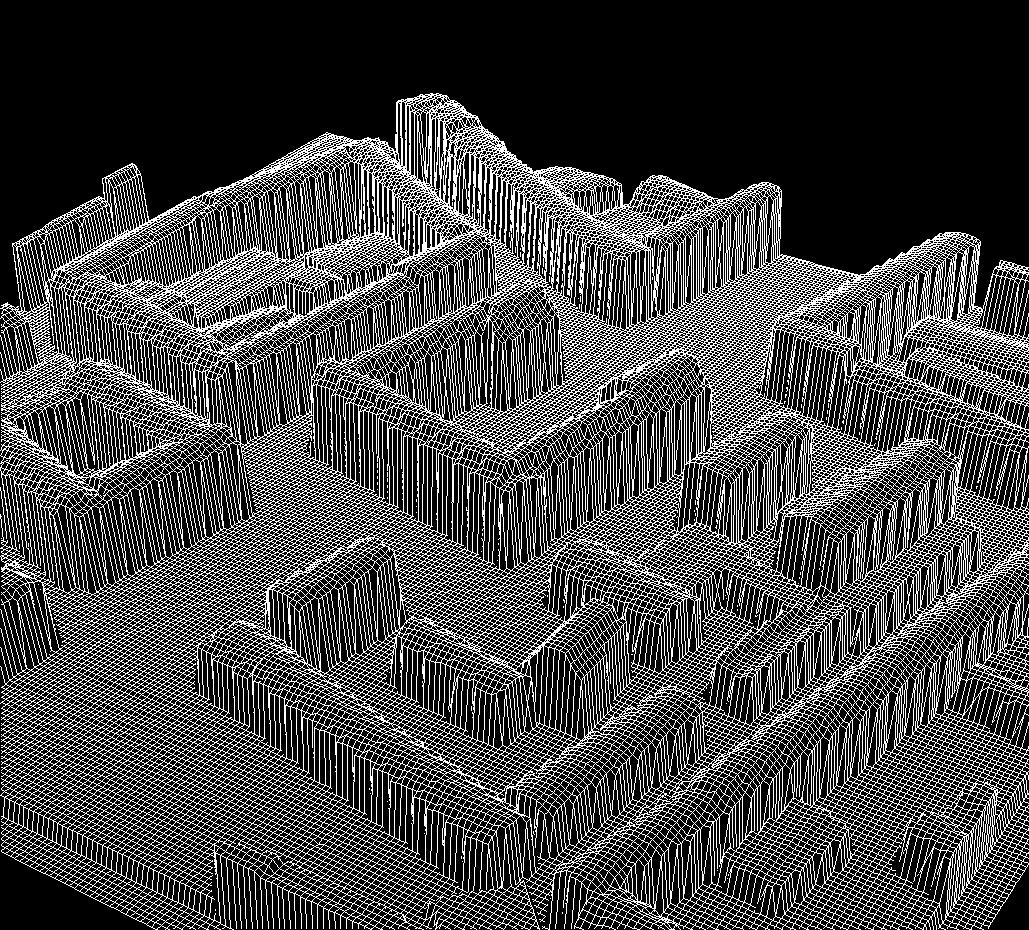
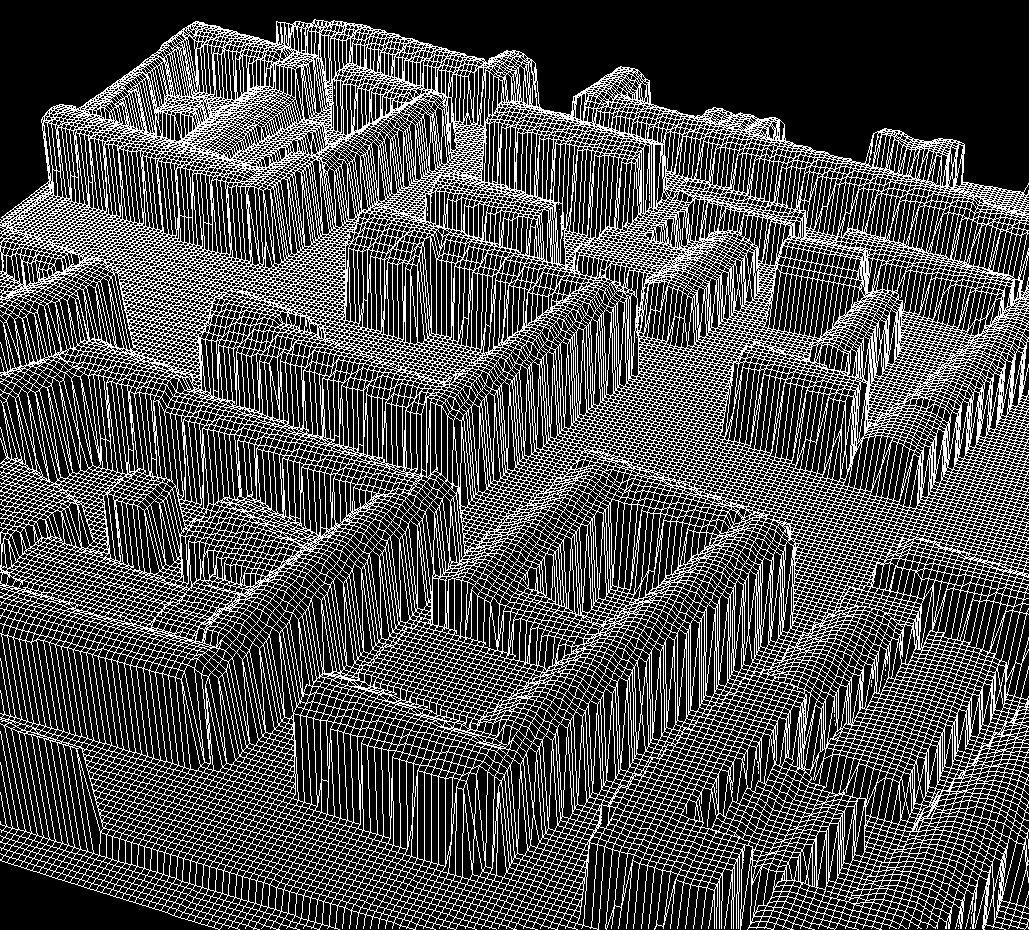
Figure n) shows the data and the result in 3D, and allows to see that mistakes are due to artifacts on the data. CommentsThe results presented here have been obtained in 40 minutes with a SUN-blade 2 (500 MHz, 250 MB). The data image size is 1060 by 1024. We should be able to deal with even worst data, if we could optimize more complex energies. Tests have been done (see [14]) with more complex prior models, using relations such as alignment or orthogonality between buildings.Results are not improved with a more complex prior model due to the optimization step. Simulated annealing looses its efficiency if the energy exhibits too many local minimas. Designing a good prior model and estimating its parameters is then hard to achieve, since we cannot obtain optimal configurations. Therefore, one way to improve the proposed technique is to work on a more efficient optimization algorithm. This will allow to improve the model and use more complex silhouettes and a bigger set of possible roofs. This will be done in a near future. |
Figure l) Original crude DEM and result of the building
extraction.
(click on the image to get the entire scene).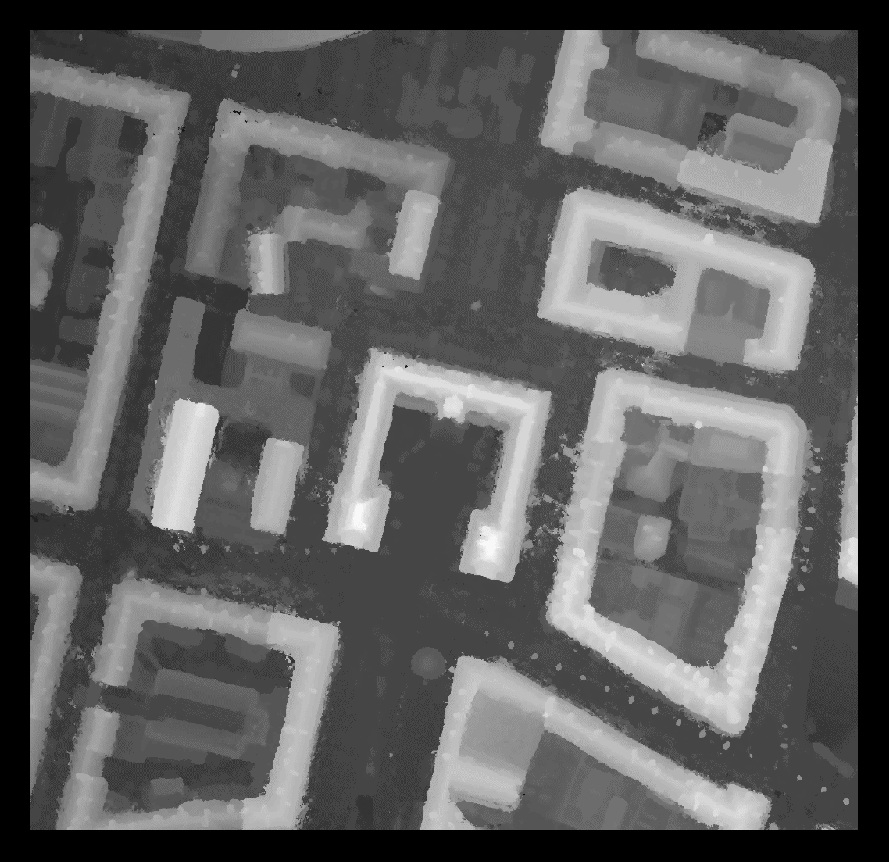 
Figure m) Estimated roofs and ground truth manually obtained
by IGN. 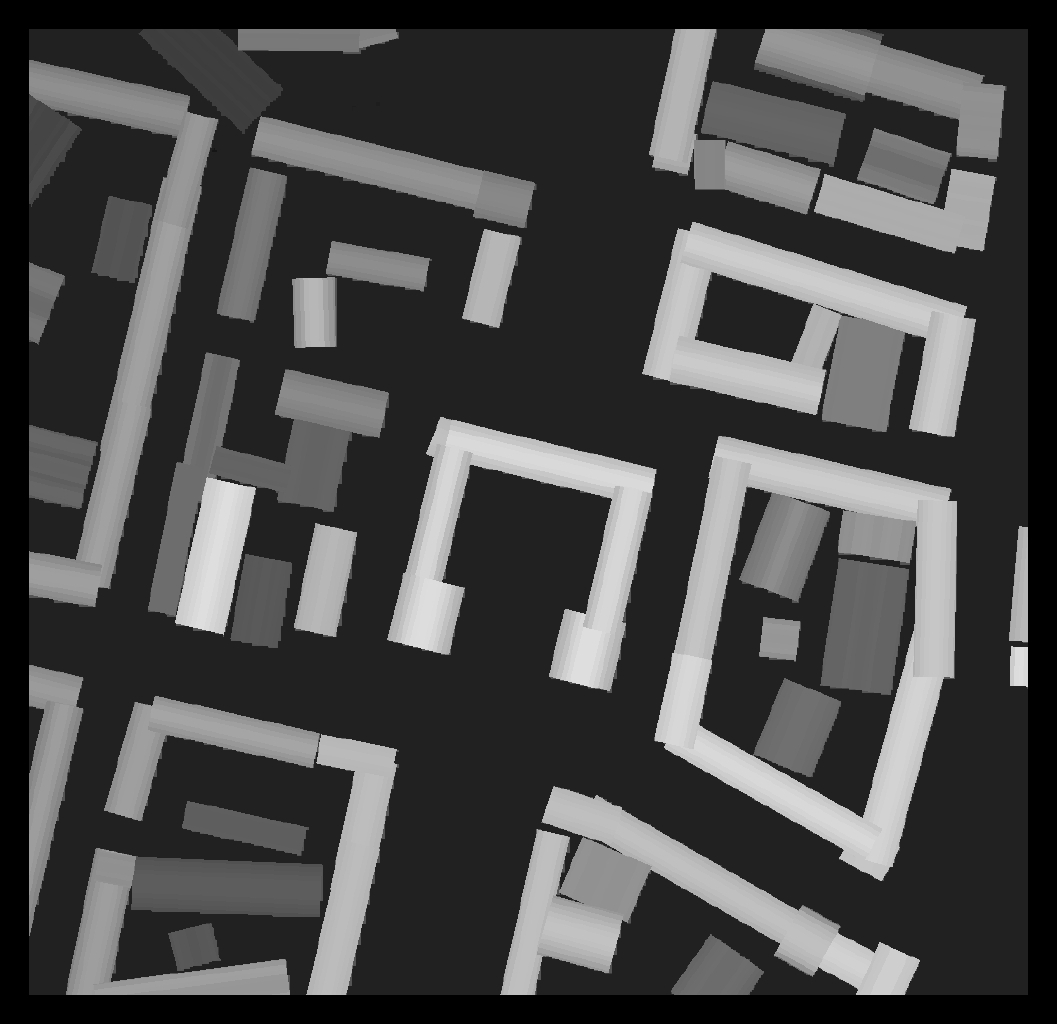 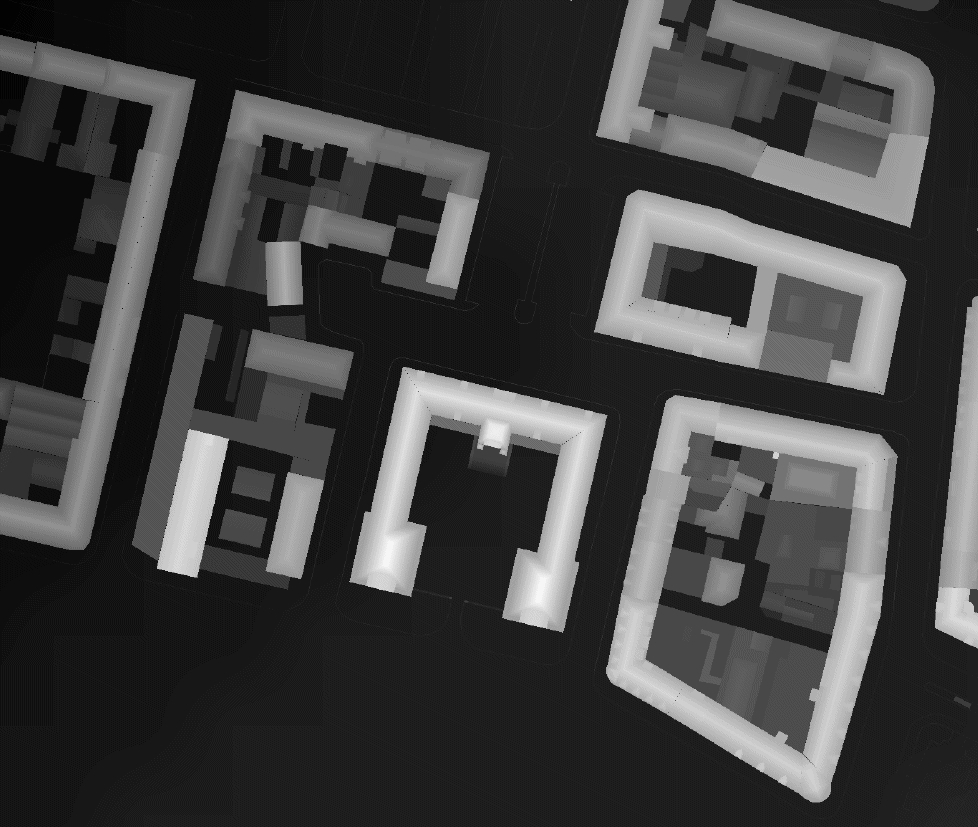 |
| Previous : Algorithm | Up : Contents | Next : Conclusion |