Video:
User Interface:
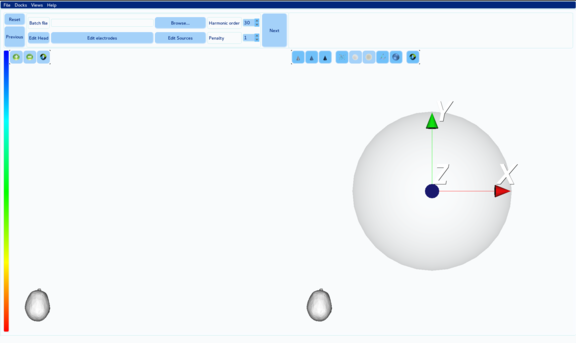
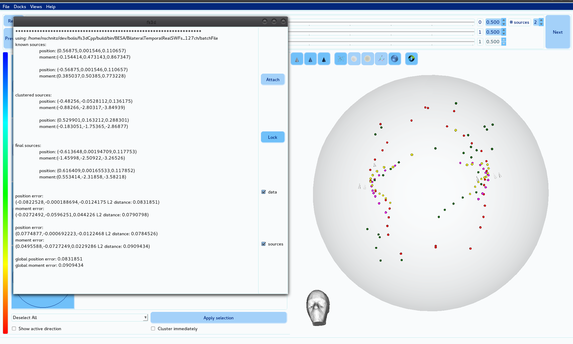
The topmost part of the application is for user input. The central part is for graphical data/results visualization. There, the results sphere or view 0 is displayed on the right with axes (default).
Usual execution pipeline:
- Starting, loading data:
Load a batch file (or batchFile). This is done either by using the button Browse in the Batch file field and selecting the file in the assistant, or by typing the path in the dedicated field.
It contains information about head model and EEG data. If the data were successfully loaded, the EEG is displayed on the left below (view 1). If known, the sources (locations and moments) are shown in view 0.
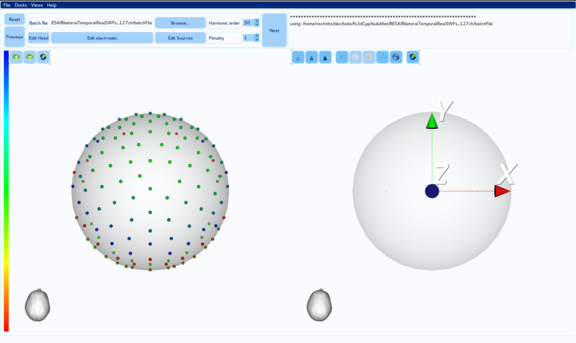
Then click on Next, so the corticalmap step is being executed.
Define scan parameters:
Once the corticalmap is finished, the three spheres showing the potentials transmitted on the three layers of the head model are displayed together with view 1 on the left below in views 2 (scalp), 3 (skull), 4 (brain surface).
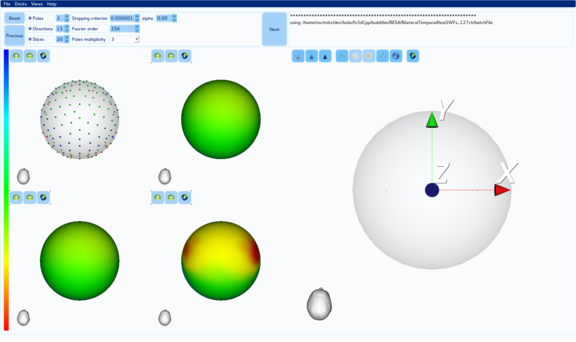
Check and set if necessary the appropriate number of poles. Other parameters default values are usually correct, but may be changed. Once it is done, click on Next again. This will launch the scan process, whose execution can take up to a few minutes (see progress bar).
Scans selection:
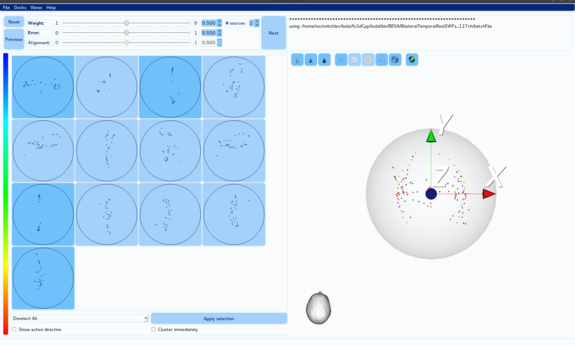
Once the scans are calculated (views 5), the user needs to select the good ones (with "watch needles" looking poles or points within the disk). The selected scans are displayed in 3D in the results sphere on the right (view 0). The points may be filtered by weight and by error using the top sliders. Once the selection is done, select the expected number of sources and click on Next.
Sources estimation:
The software then computes a first estimation of the sources (estimated sources), which is then refined in order to give the final result (final sources). The computed sources are displayed in view 0 and their numerical values are given by the optional button sources in the top right zone. This results zone can be detached as below. It also provides information on data (and warnings).
The many available controls are listed in the User interface page.