Graphical Visualization of Java Objects, Threads, and Locks
Isabelle
Attali, Denis Caromel, and Marjorie Russo
INRIA, CNRS-I3S, University of Nice - Sophia
Antipolis
The Java language combines object-oriented and concurrency features. Both sets of features are difficult to understand and handle, and combining them increases their complexity. A program developer must be aware of objects that become locked and unreachable. Another concern is static variables, which objects can access without an explicit reference to the variables and which consequently might require unexpected locking. Objects shared by two threads can lead to a concurrent access, raising a potential synchronization problem. Deadlocks are difficult to track and handle, so debugging threaded applications is very difficult.
Jitan, a visualization environment for concurrent, object-oriented programming-more specifically, for Java-provides interesting and useful solutions to these problems. Developed in the INRIA (France's national computer science research institute) Oasis project, Jitan provides both textual and graphical visualization of objects and thread activities at execution, including the object graph's topology, thread activities and status, locks, and synchronizations. Graph-oriented object visualization provides important information simply and effectively-showing, for instance, that two threads share an object.
One of Jitan's main research contributions is its formal foundation and its specific architecture based on interpretation and animation of an executable, operational Java semantics. Another important contribution is its techniques for graphically visualizing objects, threads, and locks.
From the tool designer's point of view, Jitan's formal foundation has these advantages:
- Specifications are related to Java source code; therefore, we are not limited to any Java virtual machine (standard, proprietary, or modified). Instead, we interpret the program's source (not the bytecode), using semantic rules related to Java source constructors. With the executable semantic approach, symbolic debugging requires no further program development.
- Generating the tool from specifications requires only simple instrumentations at the semantic level. For instance, switching from Java 1.1 to Java 1.2 requires only changes in the specification, not in the environment definition.
The formal foundation also has advantages from the Java developer's point of view:
- Direct interpretation enables interactive debugging.
- No instrumentation is required at the source level.
- Because interpretation takes place at the source level, developers have a better understanding of program behavior, thanks to the link between execution and source code.
- The effects of program execution are shown on the fly, via visualization and animation of the program interpretation.
- Jitan can complement traditional debugging tools.
The principles we use for graphical visualization of objects, threads, and locks apply to other Java environments, as well as to other languages with object-oriented and concurrent features.
Objects and concurrency in Java
Java is a concurrent, class-based, object-oriented programming language, which includes classical concurrent, multithread, monitorlike locks and synchronization features.[1] Executing a Java program creates objects (the main entities representing the program's execution), modifies them, and updates object references. A program's behavior during execution is therefore described by the evolution of its object list. We can distinguish particular objects called threads. Threads have an activity (a state)-that is, a stack of successive calls (a continuation)-and a status (created, runnable, executing, blocked, dormant, dead).[2] A thread in runnable status can become executing at the next execution step, whereas a blocked thread must wait for a lock release on the considered object.
Threads can execute simultaneously (on a multiprocessor architecture) or with interleaving (on a monoprocessor computer). Java provides a mechanism by which programmers can obtain a deterministic behavior for a given Java program in critical sections, using monitorlike synchronizations. This mechanism relies on locks; one lock is associated with each Java object.
Because these characteristics can be difficult to understand, we illustrate the model's main features using the classical Java producer-consumer program[3] shown in Figure 1. The program involves two consumers and one producer of data (an integer). The producer must put successive data items into a cubbyhole; two consumers then read the data items. Consumers cannot read a data item before the producer puts its first data item into the cubbyhole, and the producer must not put in a new data item if the previous one has not been read by both consumers. This example introduces several Java concepts: object and thread creation, concurrent execution, synchronized methods, and notifications.
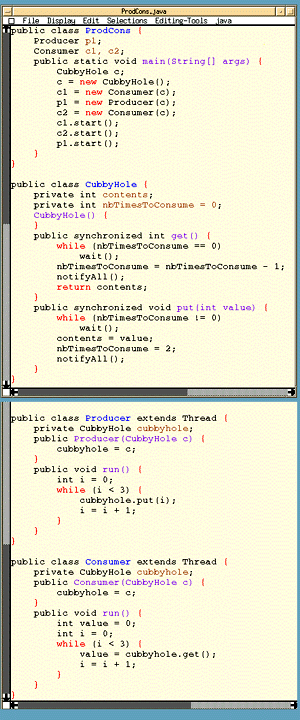 |
Figure 1. A Java producer-consumer program. |
The program
consists of four classes: ProdCons, CubbyHole, Consumer, and Producer. ProdCons is the program's main
class. Execution starts with the program's main thread, which
successively creates one cubbyhole object, one consumer thread, one
producer thread, and finally another consumer thread. Three calls to
the start method start the three
created threads, which execute concurrently (with interleaving on a
monoprocessor computer). Each thread executes the run
method defined in the class corresponding to its type. The two
consumers try to read the value contained in the cubbyhole, and the
producer tries to put a value in the cubbyhole. To avoid conflicts in
accessing the cubbyhole, the put and get
methods are declared synchronized-that is, they are declared critical
sections. To prevent deadlocks, the wait
method releases the lock hold on the cubbyhole if the data has not
been read by both consumers or put in the cubbyhole by the producer.
Execution ends when all threads have executed their main (for the main thread ProdCons) or run
method (for other threads).
Jitan vs. other tools
Several systems have been developed to help Java programmers write Java programs or, more generally, object-oriented and concurrent programs. These systems mainly provide visualization and debugging tools. (See http://www.andromeda.com/people/ddyer/java/Reviews.html for Dave Dyer's exhaustive review of Java tools. Also see Carl Dichter's ?We Test the Top Java Visual IDEs? at http://www.javaworld.com/javaworld/jw-04-1998/jw-04-visual-ides.html.)
Comparing Jitan with other Java development environments, we can highlight several common features: assistance for syntactic constructs, interactive debugging, examination of data contents, and visualization of thread activities and status. These features are minimal requirements for a modern development environment.
Our tool's more advanced features make a significant contribution to the field of development environments. The first is its graphical visualization of the object graph's topology. Other graphical environments exist-Javelin and CodeWarrior, for example, are commercial tools that are radically graphical. They present classes as boxes connected by lines representing inheritance. The boxes contain data and methods of the class and can be graphically edited. But this information, such as class hierarchy, is static; graphical visualization of dynamic information, such as references between objects, is more useful to the programmer. Moreover, visualizing synchronizations between threads is of major importance in threaded programming.
Some systems-SuperCede Java, CodeWarrior, Kawa, and NuMega-show dynamic information (objects), but their textual presentation is tree-oriented, not graph-oriented. Metamata mostly presents textual information (such as program source, a command line interpreter, and values of chosen variables). It presents no global view, so the user must compare the values of variables to detect shared objects or cycles. Jitan's graph-oriented topology visualization makes this kind of information immediately obvious.
The second important feature is interactive debugging. Jitan requires no compilation at all, in contrast to the incremental recompilation after modification or addition of a breakpoint that is usually necessary in other tools. (The exception is SuperCede Java, in which you can modify a running program without restarting it.) Jitan owes this capability to the fact that its debugger is not based on bytecode execution, possibly instrumented, and does not use a particular Java virtual machine (unlike most commercial products). Instead, it directly uses an operational semantics, instrumented with notifications. It therefore requires no user instrumentation.
Deriving a visualization environment
We derived Jitan from Java's syntactic specifications and an operational semantics of the language based on Natural Semantics[4] and Structural Operational Semantics.[5] We wrote these specifications within Centaur, a generic programming environment.[6] From the syntactic and semantic specifications of a given language, Centaur automatically produces a syntactic editor and semantic tools such as type checkers and interpreters for the language.
Syntactic specifications
Java's syntactical specification includes a concrete and an abstract syntax of the language. From this specification (written in Metal[7]), we derived a parser that transforms a program's textual form (a source file) into a structural representation (a syntactically correct abstract syntax tree). Jitan represents every structured object as an abstract syntax tree.
For example, Figure
2 shows the abstract syntax tree corresponding to the expression Obj.m_name(Expr1, Expr2). Operator names, in
lowercase, represent tree nodes; type names, starting with an
uppercase letter, define tree edges. The leaves are either variable
names (like m_name in this example) or
constants (values). The abstract syntax so defined includes 128
operators and 56 types related to Java constructors.1 As explained
later, this abstract syntax will be completed with definitions for
semantic structures.
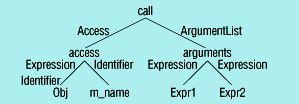
Figure 2. An abstract syntax tree for a method call.
Semantic specifications
We adopted the Natural Semantics style (also called big-step semantics) to describe object-oriented features. We used Structural Operational Semantics (or small-step semantics) to specify the multithreading semantics. Centaur handles semantics with the Typol formalism, an implementation of the Natural Semantics approach. Because this formalism is based on a logical framework, it is highly declarative and expressive but also executable.
Our operational semantics simulates concurrency with a deterministic thread interleaving. Currently, programmers can't choose a particular interleaving or act on the scheduler. We express Java operational semantics in terms of a transition system, modeling possible transitions from one configuration to another. By configuration, we mean all thread activities at a given program execution time. We model objects, threads, and configurations (a pair of objects and static variables) as semantic structures.
Description
of Typol
We
represent a Typol specification by an unordered collection of
inference rules. Typol rules can be structured into sets that deal
with the same object. Here is a Typol set, called evaluateExpression, that specifies the big-step semantics of expression
evaluation for a simple language:
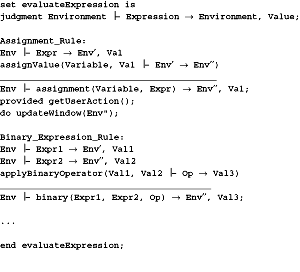
Each inference
rule consists of a finite set of premises (which is empty for an
axiom) and a conclusion. The premises (above the line) and the
conclusion (below the line) are relations represented by sequents
that express properties. Typol rules indicate how to deduce a sequent
from other sequents. We manipulate object languages via their
abstract syntax. A sequent expresses the fact that some hypothesis
(the term list to the left of the sequent symbol) is necessary to
prove a particular property about an abstract syntax term called the
subject. In the evaluateExpression example, the subject of
the rule named Assignment_Rule is the abstract syntax
term assignment(Variable,
Expr)
corresponding to the usual concrete syntax Variable:=Expr. We type sequents according to the syntactic nature of
their subject; we define this type with a judgment as shown in the
example by the line beginning with the keyword judgment. Within a
set, a premise sequent of a rule refers to the same set unless
another set is explicitly indicated by a named sequent (as with the assignValue premise in the example).
The provided clause defines a condition that the user must verify before
trying to apply the considered rule. In the example, we apply the provided clause getUserAction first to find out
whether the user wants to stop the program interpretation. The do clause indicates an action that must be executed if the
corresponding rule is proved. We use this clause especially to send
notifications to the environment (for example, updateWindow).
Semantic
structures
During execution, a Java program creates, uses, and updates objects
and threads. Objects, threads, and configurations (a pair of objects
and static variables) are modeled as semantic structures.
Figure
3 establishes the structure of objects and threads. In the case
of a simple object (not a thread), the only difference between
objects and threads is that the activity is nil.
An activity consists of a status and a continuation. A continuation
consists of
- a thread identifier,
- the name of the current method,
- an execution environment composed of parameters (name-value pairs) and local variables (name-value pairs), and
- an instruction list (language statements as well as closures for method calls).
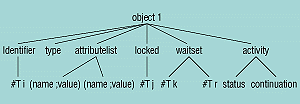
Figure 3. An abstract syntax for objects and threads.
This structure
changes during program execution, as shown in Figure 4.
The figure shows the source code of a run
method at the top left. The upper tree represents the corresponding
activity's abstract syntax (to be clearer, we use concrete syntax for
Java instructions). During program execution, the o2.foo() method call is replaced by the closure representing the
body of method foo. The lower part of the
figure is the corresponding abstract syntax tree.

Figure 4. An example thread activity.
Semantic
modules
The semantic specification contains 600 inference rules describing
Java's operational semantics. As Figure 5 shows,
they have a modular organization, which enhances the design, improves
readability, and facilitates debugging. The left part of the figure
presents the main modules; the right part presents utility modules
used by the main modules. Some modules are expressed in Natural
Semantics style-especially object-oriented features such as java_inheritance.ty. Others are expressed in Structural Operational Semantics
style-especially concurrent features such as java_stat_execution.ty, java_expr_evaluation.ty.
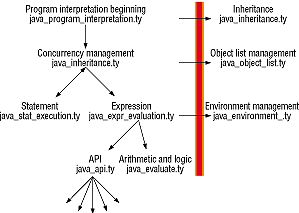
Figure 5. Semantic modules.
The
transition system
Figure 6 presents the Typol rules that specify
our transition system. We specify transitions between configurations
with rules that describe one step of a given thread's execution.
These rules take the form
<ObjL0, ClVarL0 > ®<ObjL1, ClVarL1 > ®¼
which we interpret as A system in an initial configuration <ObjL0, ClVarL0> performs an execution step and changes its configuration into <ObjL1, ClVarL1>. Execution is therefore a sequence of transitions. The initial configuration consists of a single thread object list (this thread will execute the main method) and the static variable list obtained by class loading.
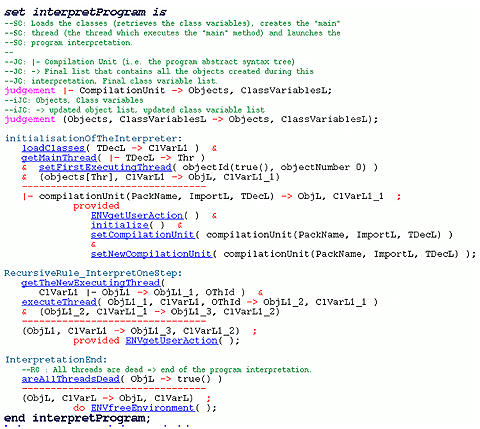
Figure 6. The Typol rules that specify our transition system.
The first rule, initializationOfTheInterpreter, of the considered set
interpretProgram initializes program execution; it creates the main
thread (the thread related to the main method), which starts
executing and calls the second rule, RecursiveRule_InterpretOneStep. In this rule, the set getTheNewExecutingThread deterministically
obtains a thread, and then the set executeThread executes it. The final rule, InterpretationEnd, corresponds to the execution's end; there is no more
thread to execute, so the given configuration is the final one. This
rule simply checks that all threads are dead.
Program animation and graphical visualization
From semantic specifications, Centaur automatically generates a simulator that takes as input a syntactically correct Java program and outputs a list of objects and threads denoting the program's behavior (or meaning). Jitan shows the object list using two visualization engines, both based on the semantic structure modeling the object list. The textual view is a direct prettyprinting of the list of objects and threads. To generate the graphical view, which shows the object graph's complete topology, we use Centaur's graph server. It builds the graph's nodes and edges by traversing the abstract syntax tree representing the object list. For each object, it creates a node representing the object, and for each attribute or local variable value that is a reference, it creates an edge between the two involved objects.
The Jitan user does not directly control the drawing of the graph. It is the graph server's responsibility to use a specific node placement heuristic and to determine the edges' form (curved or straight). But the user can interactively modify node and edge placement with the mouse.
The semantics interpreter reports semantic structure changes to the environment, which then sends the corresponding graphic structure to the graph server. The environment also sends the graph server instructions to create edges and arrows between nodes. The graph server defines structures for each graph entity.
To provide graphical animation during program execution, the semantics interpreter notifies the two textual and graphical visualization engines of important events (state changes). A notification is a call to highlighting primitives, with the concerned entity (where a change occurs) passed as a parameter. The semantics is equipped with notifications. The successful execution (proof) of appropriate semantic rules triggers the notification (if it exists), and the visualization engines become aware of a modification in the semantic structures. Notifications tell the engines to change a field's value or a thread's status or to add or remove a lock on a given object or an arc between two objects.
Altogether, we needed to equip less than 10 semantic rules with notifications. For the graphical engine, the rules triggering notifications are
- object and thread creation,
- thread status change (runnable, executing, locked),
- object status change (locked, unlocked), and
- variable, attribute, or continuation updates.
The notifications are not scattered throughout the specifications but concentrated in two modules: object list and concurrency management (see Figure 5).
A critical aspect of visualization is incrementality. To achieve efficient, high-quality visualizations (avoiding flashing), Jitan computes and displays changes incrementally in both views. Without program instrumentation by the user, execution can proceed step by step, stop and resume, or abort at any time. Thus, the user controls and paces the animation.
Visualization
Figure 7 shows the windows of the Jitan interpretation environment during execution of the producer-consumer program presented in Figure 1. In Figure 7a, a control panel provides debugging tools (step-by-step execution, interpretation speed, and so on). In Figure 7b, the programmer can study a detailed call stack of each thread (stack or continuation). Figure 7c presents the object list in textual form: objects (including thread objects) with their type and attribute values. The graphical view in Figure 7d features the object graph's topology. It shows thread status (dead, dormant, blocked, executing), and locks. The final two windows provide summary views: object status (Figure 7e) and thread and object interactions (Figure 7f).
 |
Figure 7. Windows of the visualization environment: (a) control panels, (b) thread activities, (c) textual view of objects, (d) graphical view of objects, (e) object status, and (f) thread and object interactions. |
Object list: Textual visualization
The windows provide redundant information to help the programmer find it easily at various stages. For example, checking the value of a given field or whether an object is currently locked is often a problem. So Jitan provides two windows (Figures 7b and 7c) that give a textual presentation of the current object list during program execution.
Programmers can track a problem if they know what has been executed and by which thread. In sequential applications, following the execution with the program text might not be difficult, but it is nearly impossible when several threads are executing several methods at once. The window in Figure 7b lets programmers see each thread's status and current continuation. The continuation's instruction list is updated at each execution step, displaying only instructions yet to execute, not those that have already executed. Thus, the programmer can focus on the next instruction. And, more important for concurrent applications, the programmer has the status information for each thread.
When programmers encounter problems during program execution, their first idea is to check objects that have already been created and their attribute values. The textual window in Figure 7c presents this information without any instrumentation:
- each object
type-for example,
CubbyHolefor object #1; - the field
(attribute) list-two fields for object #1: contents, with the value
0, and
nbTimesToConsume; - whether the object is locked, and, if it is, what object locks it-for example, object #1 is locked one time by thread #T4;
- the object wait set (if it is not empty);
- the
distinction between objects and threads-an object is labeled
#i, and a thread,#Ti.
Graphical presentation
Another problem in object-oriented programming is the object topology's dynamic evolution. With a textual presentation, discovering which objects are directly or indirectly connected by a reference can be difficult. So a graphical depiction of references between objects is very useful. Jitan provides a graph-oriented object list representation that makes connection visualization obvious and immediate. Most systems offer only a tree-oriented representation that compels the programmer to compare field values to follow connections between objects.
Figure 7d illustrates the graphical visualization of an object list obtained during the producer-consumer program interpretation. In the graph, elliptical nodes stand for objects or classes, and black arrows symbolize references between objects. Threads are distinguished by a rectangle around thread names. The visualization highlights references (arrows) between objects and object types (labels). Different colors make thread status visible.
By clicking on an object, the programmer can use a zooming process to examine the object's references-that is, fields and local variable values. In this mode, variable names (field or local variable) appear in a rectangular node attached to the corresponding arrows. A smaller font and a dark blue frame distinguish local variables.
To debug a program or to understand its behavior, the programmer must notice directed acyclic graphs and reference cycles between objects. A DAG can represent a potential shared access on a given object and race conditions in the presence of threads. Jitan's graphical view makes it easy to detect such situations. If two threads reach the same object through several successive references, the two threads share the object, potentially leading to a problem of protecting the shared data. For example, one thread might call a method that modifies this data during its reading by the other thread, leading to a coherence problem. In that case, synchronization is necessary to avoid concurrent data access problems. With the zooming feature of our graphical visualization, the programmer will see that several threads can access an object. This indicates the need for synchronization to protect the object's fields.
Visualization of static variables requires special treatment. Static variables are attached to their class and therefore are common to all objects that are instances of this class, whereas instance variables (nonstatic fields) are attached to their instance object. The graphical view must represent static variables, but the chosen representation must let programmers easily differentiate static and instance variables. Our solution is to display classes that have static variables-as shown, for instance, on the left side of Figure 8. Objects referenced by such a class (or the static field values) are accessible to every object of this type.
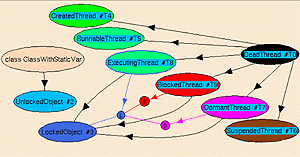
Figure 8. Objects, classes, locks, and thread status.
To keep the
topology simple, we do not show a link between an object and its
static variables. But a programmer can easily locate such static
references. Considering an object, the programmer knows its type by
the object label. If the corresponding class is represented in the
graph, the object has static variables, which the programmer can
visualize by zooming on the class. In Figure 8,
for example, ClassWithStaticVar has a reference on
object #2 (an unlocked object). For readability, the graphical
presentation gives no other information. The programmer can refer to
the textual presentation for information such as thread activity.
Summary views
Concurrent systems have many threads and objects with complex interactions between them. Jitan's summary views of objects and threads facilitate the task of understanding complex concurrent behaviors, especially when the graphical presentation contains too many nodes.
The ability to see, for instance, that no thread can proceed with execution, or that at least one thread is not dead or blocked, is useful in detecting deadlocks or livelocks. Moreover, a created threat that never becomes runnable may indicate a problem in the program. The window in Figure 7e presents objects and threads classified by status. We can see that thread #T4 is executing, #T3 is blocked, #T2 is dormant, and #T0 is dead. This window also shows which objects are locked-in the considered example, object #1.
Errors in recursive method calls are common. Detecting a thread that successively calls methods on a single object or on a cycle of objects can be very helpful to the programmer. In Figure 7f, the window presents the thread stacks and the object activations. In the upper part of the window, the programmer can see which object each thread is currently working on and the chain of objects leading to that point. For example thread #T2 is executing a method on object #1.
Placing synchronizations is a crucial problem in concurrent applications. To avoid nondeterminism, an access to a shared data item (an object field) must be enclosed in a critical section (a synchronized block). It is therefore useful for the programmer to know of any concurrent accesses to objects. Our tool lists all the threads currently accessing each object in the system (including threads that are objects). From the lower half of Figure 7f, we know that object #1 is currently accessed by threads #T2, #T3, and #T4. Therefore, synchronization might be required on all methods accessing this shared object.
Synchronizations and locks
To understand, at a given execution step, why there is a deadlock or if a critical section is required, the programmer must know which objects are locked and which threads are blocked. The textual information is a first answer to that question. However, this information is not sufficient on its own, so Jitan graphically visualizes synchronization mechanisms and locks.
First, Jitan visualizes thread status by color coding (red for blocked, black for dead, purple for dormant, and so on). During execution, it also show locked objects (light blue for unlocked objects, dark blue for locked objects). The graphical presentation highlights synchronization information in an animated fashion. This feature requires the introduction of the following arrows between objects:
L(locked)arrow-exhibits a lock (obtained by the thread when it calls a synchronized block or method on the considered object) between the origin thread and the destination (locked) object.B(blocked)arrow-links a thread and a lock on an object. Establishes that the origin thread is blocked, waiting for a lock on an object already locked by another thread.D(dormant)arrow-links a dormant thread and a lock on an object. Indicates that the dormant thread (which has called itswaitmethod) will compete to hold this lock as soon as it is re-enabled (by the thread that owns the considered lock and will call thenotifymethod on the object) for thread scheduling.
Figure 8 presents the color and graphical codes corresponding to object, class, lock, and thread status.
For lock
visualization, a first possibility was to make the lock visible on
the reference between the thread and the concerned object. But a
thread that has no direct reference on an object can hold a lock on
it indirectly through other objects. The objects on which a given
thread can hold a lock are the transitive closure of accessible
objects from that thread attribute (including transient), statics,
and variables of its run method.
Figure 9 shows an example of a thread that locks an object on which it has no direct reference. This program creates a communication chain, shown topologically in Figure 10. Thread #T0 holds a lock on object #3, but this lock is obtained through three successive method calls (via objects #1, #2, and #3). This implies that the information cannot be attached to a reference but must have its own representation.
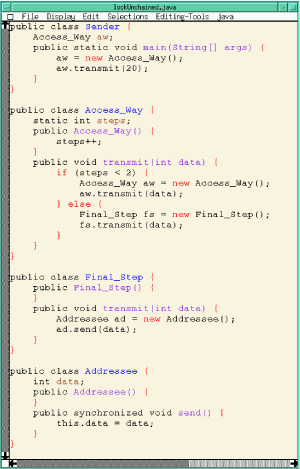 |
Figure 9. A communication chain. |
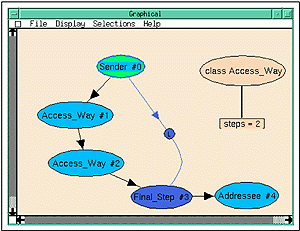
Figure 10. An example of an indirectly locked object.
Synchronization animation
Figure 11 demonstrates how the animated graphical view shows synchronization and status information during the producer-consumer program's execution. This program has four threads and one object. The main thread (#T0) creates the three other threads (two consumers, #T2 and #T4, and one producer, #T3) and the object (CubbyHole #1), and starts the thread Consumer #T2.
 |
Figure 11. Synchronizations. |
In Figure 11a, the three threads have started. Consumer #T2 and Producer #T3 are runnable and Consumer #T4 is executing. CubbyHole #1 is locked by Consumer #T2 (indicated by an L arrow and a dark blue color for CubbyHole #1).
Later (Figure 11b), the main thread (#T0) is dead (black node). Consumer #T4 has tried to access CubbyHole #1 (a call to the synchronized get method) and is now blocked (red and a B arrow). Consumer #T4 is waiting for the lock on CubbyHole #1 (which is still owned by Consumer #T2). Consumer #T2 has locked CubbyHole #1 before Producer #T3 could put a value in it (and therefore Consumer #T2 has no value to read).
In Figure 11c, Consumer #T2 has called its wait method to enable Producer #T3 (perhaps after several execution steps) to finally get the lock on CubbyHole #1 and to put a data item in it. Consumer #T2 releases the lock (CubbyHole #1 and its lock are now in light blue) and becomes dormant (indicated by the purple color and the D arrow link to the CubbyHole lock).
In Figure 11d, Consumer #T4 resumes and gets the lock on CubbyHole #1. Producer #T3 is therefore blocked, waiting for this lock. For the same reason as before, Consumer #T4 will become dormant, and Producer #T3 will resume and hold the lock on CubbyHole #1. Later, Producer #T3 will release the lock. Consumers #T2 and #T4 will resume and compete to get the lock on CubbyHole #1 and to read the data.
Example of deadlock detection
The previous
section described the producer-consumer program's normal execution.
To describe the deadlock detection mechanism, we transform the
program as follows: Two producers put a data item in a cubbyhole.
This data is read by two intermediate consumers (InterConsumers), which transmit it to another cubbyhole. Lastly, two final
consumers (Consumers) read it. We have
transformed the program's main class, which is now called DLProdCons. Figure 12 shows the two new classes, DLProdCons and InterConsumer.
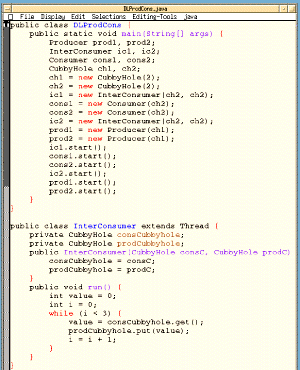
Figure 12. Deadlock example in a producer-consumer pattern.
When we interpret
this new program, we get the graphical view presented in Figure
13, which informs us that there is a deadlock. Indeed, all
threads are either dead (DLProdCons #T0) or dormant (other threads).
So no thread can execute itself. Looking carefully at Figure
13, we observe that a group of dormant threads and objects
appears disconnected from the rest of the program. That is, there is
no reference between CubbyHole #1 and InterConsumers #T3 and #T6. To
get the data placed in the first cubbyhole, and to wake up dormant
threads, the two intermediate consumers must have, at least
indirectly, a reference on this cubbyhole. So the problem most likely
concerns the intermediate consumers. Zooming on InterConsumer #T6 (Figure
14) shows us that its two attributes consCubbyhole and prodCubbyhole have the same value,
the CubbyHole #2 reference. The two concerned arrows are pointing to
the same object.

Figure 13. Deadlock detection.
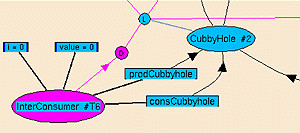
Figure 14. Zoom on deadlock cause.
The error is
therefore related to these attribute values. We can see that the prodCubbyhole attribute has the good value-the CubbyHole #2
reference-because the intermediate consumers are producers for the
second cubbyhole. But the consCubbyhole value must be the
reference of CubbyHole #1, because the intermediate consumers must
obtain the data contained in this cubbyhole to transmit it to the
second cubbyhole. So the cause of the deadlock is an error in the
initialization of the intermediate consumer attributes. After this
error, all threads (except #T0, which is dead) are waiting for
something. The two final consumers are waiting for a value from the
second cubbyhole. The two intermediate consumers are waiting for the
same thing (instead of waiting for a value from the first cubbyhole).
The two producers are waiting for the reading of the value placed in
the first cubbyhole.
Now that we
understand the deadlock cause, we must correct the program-that is,
find where the intermediate consumers are created and initialized.
They are created by the main thread, in its main method-the statement ... = new InterConsumer (ch2, ch2). The error is that we
transmit the same cubbyhole reference twice. The correct statement is ... = new InterConsumer (ch1, ch2). Figure
15 presents the object topology after correction.
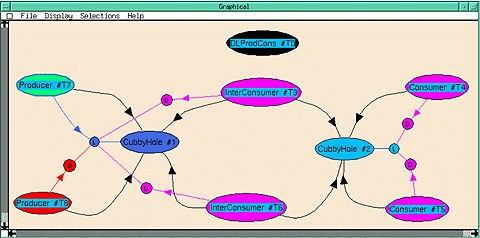
Figure 15. Topology of corrected version.
Abstract views of the object graph
Jitan users can abstract an object graph that represents a Java program's execution. An abstraction lets programmers consider real Java programs with a large number of objects and threads. It also provides a clearer view of a selected part of the constructed graph. An abstraction can focus on an object subgraph-for example, by graying out the other parts of the global graph without changing shapes. An abstract view also can visualize only this subgraph and what happens to it during program execution.
An abstraction of the global object graph can visualize only threads and objects that are directly or indirectly referenced by a given thread (indicated by the user). During program debugging, we may find it interesting to precisely analyze a new thread in the graph execution without seeing the other threads, which are known not to cause any problem. On the other hand, to precisely study interactions and possible deadlocks between two threads on a shared object, we must see both thread subgraphs,.
Figures 16 and 17 give an example of an abstraction of a given program. The main thread #T0 (the thread related to the main method) creates two well-known patterns: a binary tree and a producer-consumer system. Every BinTree object is built through an object factory method, which explains the references between the main thread and all the BinTree objects. The obtained object graph, visualized in Figure 16 without user instrumentation, is complex. In such a view, detecting patterns or independent subgraphs is difficult. But if we ask for an abstraction of thread #T2, we see a partial view of the object graph, as shown in Figure 17. In this view, we can immediately recognize a classical binary-tree pattern.
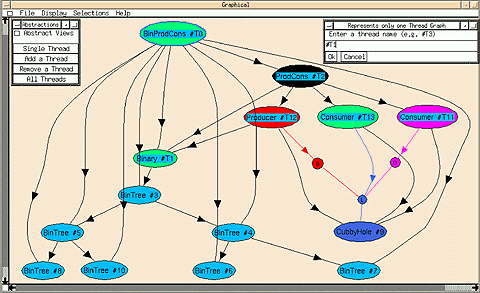
Figure 16. Global view of an object graph.
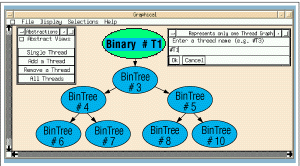
Figure 17. View of the object graph abstracted to the thread #T1 subgraph.
The additional insights offered by abstraction are very important for the understanding of a large application. This capability enables programmers to find recurrent patterns or to precisely study independent subgraphs at runtime.
Our current platform demonstrates the feasibility of the approach we have described here. Other environments can also use these principles. Graphical visualization can be useful even for single-threaded systems. For instance, in the context of smart cards, only a few (less than 20) objects are involved, but security issues make program understanding crucial. Discovering an object shared by two different applications on a card would be a major security issue. Moreover, we can imagine designers using Jitan to automatically produce an object topology for use in reverse engineering. Teachers might use the environment for teaching concurrent and object-oriented concepts.
In terms of performance and scalability, Jitan is operational and already supports medium-size programs. It has handled applications with more than 100 objects, running on standard workstations. For the sake of animation, we must slow down the execution speed, so that the user can see and understand what is happening during program execution. When needed, we can show only an abstract view of the object graph (a subgraph of a given thread). This feature lets us handle complex systems efficiently and increase scalability. (For further information, see http://www.inria.fr/oasis/jitan.)
Our further experiments will focus on two main goals. First, in graphical abstraction, we are exploring techniques for displaying only threads (not objects) or only certain types of objects. These techniques require specific rules and treatments because graph connectivity is not obvious and is therefore difficult to maintain. We also want to add a feature that would let the user control interleaving between all threads (for example, artificially blocking or slowing threads). This feature would allow programmers to explore various potential behaviors such as infrequent deadlock conditions.
References
- J. Gosling, B. Joy, and G. Steele, The Java Language Specification, Addison-Wesley, Reading, Mass., 1996.
- S. Oaks and H. Wong, Java Threads, O'Reilly, Sebastopol, Calif., 1997.
- M. Campione and K. Walrath, The Java Tutorial (Object-Oriented Programming for the Internet), Addison-Wesley, Reading, Mass., 1998.
- G. Kahn, "Natural Semantics," Proc. Symp. Theoretical Aspects of Computer Science, Vol. 247, Lecture Notes in Computer Science, Springer-Verlag, Amsterdam, 1987, pp. 22-39.
- G.D. Plotkin, A Structural Approach to Operational Semantics, Report DAIMI FN-19, Computer Science Dept., Aarhus Univ., Aarhus, Denmark, 1981.
- P. Borras et al., "Centaur: The System," Proc. ACM SIGSOFT/SIGPLAN Software Eng. Symp. Practical Software Development Environments, ACM Press, New York, 1988, pp. 14-24.
- G. Kahn, B. Lang, and B. Mélèse, "Metal: A Formalism to Specify Formalisms," Science of Computer Programming, Vol. 3, North-Holland, Amsterdam, 1983.
| Feedback? Send
comments to dsonline@computer.org.
This site and all contents (unless otherwise noted) are Copyright ©2001, Institute of Electrical and Electronics Engineers, Inc. All rights resserved. |