Tumour Growth Modelling in the Brain
2. A Macroscopic Patient Specific Growth Model
The aim of mathematical growth models is to explain the underlying dynamics of the tumour growth in detail. As a result these models can be very complicated and very specific to certain situations. Patient specific modelling on the other hand, aims at creating flexible models that can be adapted to different patient cases, with obviously a trade-off in the level of detail included. This ability to adapt is crucial to build the link between theoretical models and clinical applications. Such models are usually less complicated and have few parameters that can be measured from clinical data. The biggest advantage of patient specific models is that they can be used in therapy planning and prediction of the growth for the specific cases.
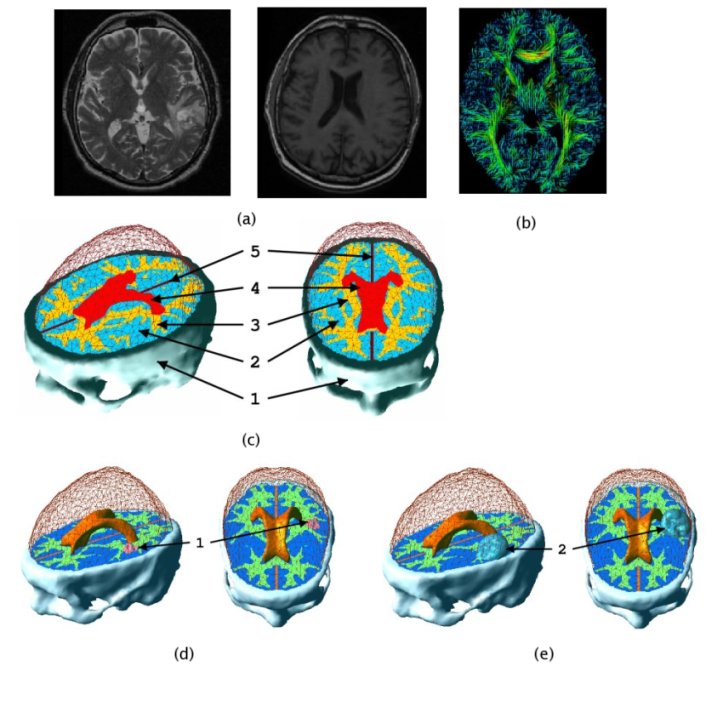
In patient specific growth modelling, the formulations are based only on the observations that can be gathered in the clinical environment such as images, genetic data and histology. Here, we present a patient specific model based on MR images proposed in [Clatz et al., 2005]. This model concentrates on the information coming from the anatomical (T1 and T2 weighted) images and diffusion weighted images. T1 and T2 images are used to segment/delineate the bulk tumour (gross tumour volume 1 - GTV1), the tumour infiltrated oedema (gross tumour volume 2 - GTV2) and the white matter. Diffusion weighted images are used to extract fibre directions, which guides the tumour infiltration (See the figure below). The growth model is divided into two different parts: the diffusion, and the mechanical model.
2.1 Diffusion Model
The diffusion model explains the infiltration of tumour cells into the brain parenchyma and the proliferation of tumour cells. The model is formulated in the reaction-diffusion formalism as given below. Change of tumour cell density at a point u(x) is described by an anisotropic diffusion and a nonlinear reaction process.

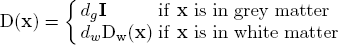
The infiltration of tumour cells is explained by the diffusion process ∇(D(x)∇u), which is characterised by the diffusion tensor D. The proliferation of tumour cells are embedded in the reaction part ρu(1-u) with the mitosis rate ρ given in terms of doubling rate. The Neumann boundary conditions (D∇u)n dictates that tumour cells will not pass through the skull nor the ventricles. The diffusion tensor D is constructed following the observation of [Giese et al. 1996] saying that tumour cells move faster on the myelin sheath and also discussions with neurosurgeons who suggested that tumour cells follow the fibre tracts. Thus, D is an isotropic tensor in the grey matter infiltrating in all directions equally. In the white matter, D is an anisotropic tensor following the white fibre tract with a higher mean diffusion than in the grey matter:
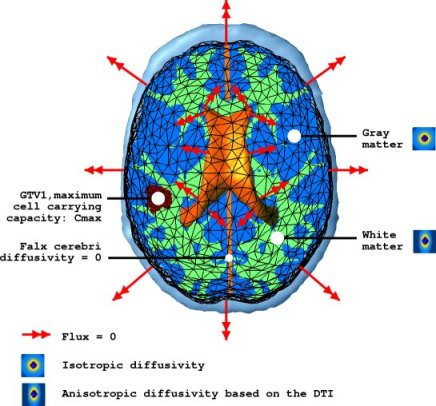
The following figure summarises the diffusion properties of different tissues in the brain.
2.2 Mechanical Model
The mechanical model concentrates on the mass effect of the tumour growth on the surrounding structures. As the tumour grows, due to abnormal speed of mitosis and the infiltration, surrounding tissues are deformed. This deformation is formulated by coupling the pressure caused by the change in tumour density with the material characteristics of the brain structures. Brain parenchyma is an extremely complicated material and a full mathematical description would be complex. Here, the parenchyma is assumed to be a linearly elastic material for simplicity. The constitutive equations for the brain parenchyma is given with the following system.
where ε is the stress tensor defining the pressure exerted by the tumour growth, σ is the strain tensor defining the deformation, λ and μ are the Lamé coefficients and v is the displacement. Other material properties are summarised in the following figure.
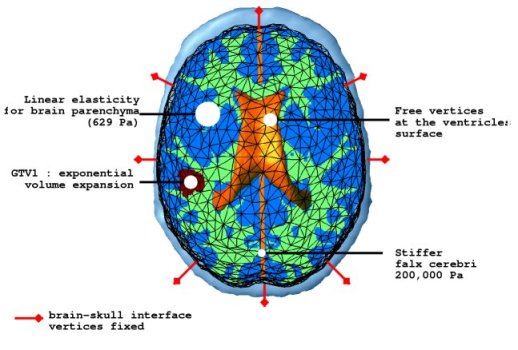
The pressure exerted by the growth of the tumour is modelled in two different parts. The bulky part of the tumour grows solely by proliferation without diffusion. The mechanical effect of this proliferation is modelled as a constant outward pressure describing expansion of GTV1. On the other hand, the mass effect of the infiltrating tumour cells is described by a local pressure based on the tumour density. The mass effect formulation is given as follows.
where Fe represent the external forces and the α is the coupling factor between the diffusion model and the mechanical model.
2.3 Growth Simulation
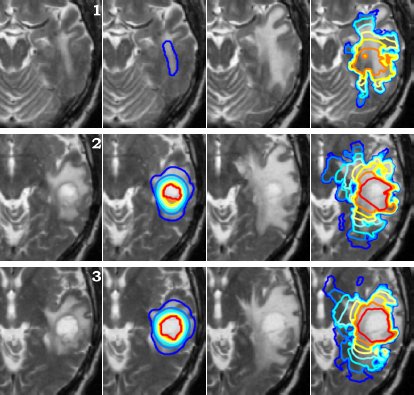
Using the models explained above one can simulate the tumour growth for a specific patient case. The output of the model for a patient suffering from a high grade glioma is shown in the following video.
Using two different images of the patient taken at different times we can compare the simulated growth with the actual growth. We observe that the simulated growth highly resembles the actual observed growth between the successive MR images although there is still a difference. This difference can be reduced by optimising the parameters of the model for the patient and using better segmentation techniques.
2.4. References
- [Giese et al., 1996] Giese, A., Kluwe, L., Laube, B., Meissner, H., Berens, M., Westphal, M., 1996. Migration of human glioma cells on myelin. Neurosurgery, 38.
- [Clatz et al., 2005] Clatz, O., Sermesant, M., Bondiau, P. , Delingette, H., Warfield, S. Malandain, G., Ayache, N., 2005. Realistic simulation of the 3d growth of brain tumors in mr images coupling diffusion with biomechanical deformation. IEEE TMI, 24.