


The Graphical User Interface
Mascopt Viewer
The Viewer is quite complicated to use because it permits to view a large amount of graphs. In this part, we don't describe how to use the viewer by the code. We only describe the user interface and how to use, with your mouse, the viewer.
Launch the editor
java applications.Viewer
or
./bin/Viewer
If you use directly the jar files, provided on the tools page, launch directly the jar file:
java -jar Editor.jar
Use of the Viewer
The viewer is composed of the main window, wich allow to control what is viewed in the views. Then you can create other windows wich are called "Views" because offering different views on several graphs. Each view can display different Layers at the same time. And each layer contains a list of graphs. With this system you can display in one view a layer containg for example the request graph and a network and, in an other view, the network and several paths on it. As the viewer is quite flexible it explains why it is not simple to use.
Managing Views and Layers.
Multiple views can be opened clicking on "New View" button. When a view is created, a new tab View #n is added in the Views section. In each View, you have at the bottom right the list of Layers in it. At the beginning, the new view is empty: you have to add a new layer in it. You can also add a layer which is already used in other view (this is the notion of shared layer). Note also that a Layer can be visible or hidden in a view. To remove a layer from a view, you can click on the X button at the top right.
Managing graphs in Layers
When you have created your new layers in views, then you can switch to the Layers Tab to view all the available layers. In each layer you can add some graphs, digraph, chains or paths. As you want to put in your layer some graphs from files, first you must scan a file. Select this option in the drop down list called "Add Graph", then select a file and all graphs contained in this file will be added in the drop down list. To add a graph, you just select the layer where you want to put it and then, you select the wanted graph in the drop down list.
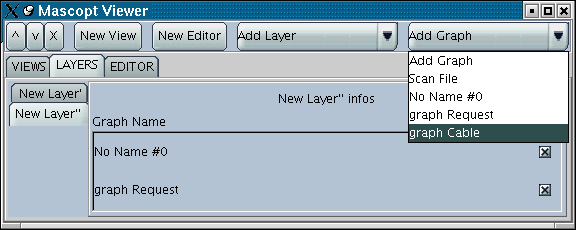
When the graph is added in the layer, it appears in the list and in all the Views which contains the concerned layer. You can also hide a a graph clicking in the checkbox on the right. To remove a graph from a layer you can click on the X button at the top right.
The tab editor in the viewer
We added an editor tab in the viewer because the user may have to change a graph in a file. It works as describe below.
Mascopt Editor
This is a graphic interface which allow to allow a graph, change values on edges and vertices.
Launch the editor
java applications.Editor
or
./bin/Editor
If you use directly the jar files, provided on the tools page, launch directly the jar file:
java -jar Viewer.jar
Use of the editor
The editor is composed of two things: the main window with a "tool bar" to change the different uses of the mouse and a view of the current graph wich id edited.
Action buttons
- New Graph: creates a new empty graph
- New Di Graph: creates a new empty digraph
- Load: pop up a file browser. Select a file from where to load a graph (erase the current graph)
- Save: save in mgl format the current edited graph
- New View: create a new view (a new window) on the graph
- Insert Graph: load a graph from a file (not erasing the current graph)
- Dump: dump the view of the graph in an image file (PNG format)
Mouse behavior
- Create: clicking on the view, it creates a vertex. Clicking on vertices, it creates edges.
- X: clicking on vertices or edges delete it.
- Set Name: clicking on vertices or edges pop up a text field to change the name of the object.
- Set Color: clicking on vertices or edges change its color.
- Set Value: clicking on vertices or edges pop up a dialog box to change any value on objects. Refer to the javadoc concerning vertices and edges and the notion of values. You can also have a look at Graphs
Labels
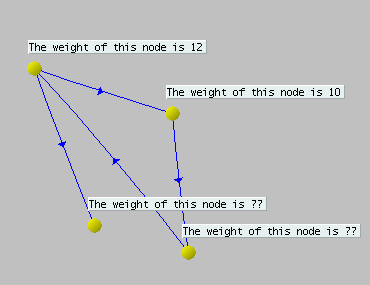
The labels depends directly of the values set on objects. When you change the value on a vertex or an edge, nothing seems to appear. If you want to see it, you have to configure the labels. You have two main buttons: Set Vertex Label and Set Arc Label. When you click on it, a pop up appears with a textfield where you can put a string. This string will appear on all vertices or edges. But you can also use variables wich will read the value on each objects. The syntax is quite simple: to access a value named for example "myvalue", you should write $(value).
Example:
Imagine you have put a value name "weight" with value 12 on the first vertex and also on an another with value 10. Then, you click on Set Vertex Label and you enter the string "The weight of this vertex is $(weight)". You obtain this:
The View
The window containing a view of the graph is simple to manipulate. When you click you perform one the Mouse behavior. You can also drag and drop vertices, and drag and drop all the graph (clicking anywhere). With the whell of your mouse, you can modify the zoom of the view.