Tumour Growth Modelling in the Brain
4. Extrapolating Tumour Invasion
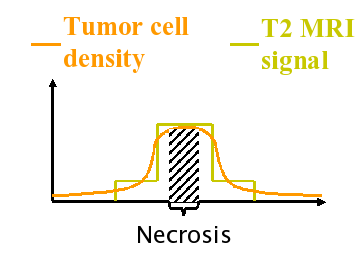
The diffusive nature of glial tumours inhibits the apparent boundary between cancerous and healthy regions, decreasing the effects of conventional therapies like surgical resection and radiotherapy. The current imaging techniques are able to detect only a part of the total tumour [Tracqui et al., 1995]. In the literature, there are several suggestions for the lowest detection limit of CT images in terms of number of tumour cells per unit volume or area. The Figure following this paragraph illustrates the tumour profile which is visible in the image (the solid line curve), and the theoretical total tumour profile. The usual clinical practice is to remove surgically the visible part, and to try to kill tumour cells which are not visible in the images using radiotherapy and/or chemotherapy. The conventional radiotherapy treatment uses a geometric approach and applies radiation in a volume defined by constant margin of about 2 cm around the surgical site. This approach does not take into account the different speeds of tumour diffusion for the grey and the white matter [Giese, 1996]. Using the same margin for both tissues may kill healthy grey tissue while not reaching the extent of tumour cells in the white matter, leaving alive cancerous cells on the fibres. By constructing physiologically determined radiotherapy margins taking into account the tumour growth dynamics and the properties of the tissue, the therapy may be more effective.
The work explained here proposes a method to estimate the distribution of tumour cells for low density regions using a single image and a set of estimated parameters [Konukoglu et al, 2006]. Our formulation constructs an approximation of the tails of the tumour distribution (invasion margins) which are not visible in images. In addition, this formulation creates appropriate initial conditions for tumour growth models, which can be used for simulating tumour growth and predicting the distribution of the tumour in a future time. Using an initial condition with well estimated tails will increase the ability of these models to predict not only the tails of the tumour density, but also the whole distribution.
4.1 Method
Our formulation is based on the Fisher-Kolmogorov equation, which is been widely used to model the growth of brain tumours, [Murray, 2002]:
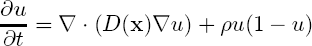
where u is the tumour cell density, ρ is the average proliferation rate of tumour cells and D is the diffusion tensor which characterises the diffusion behaviour of cancerous cells. D is taken to be spatially varying with a higher determinant on the white matter yielding a higher diffusion rate. It is also taken to be an anisotropic tensor following the fibres in the brain using the diffusion tensor images (DTI), as proposed in [Clatz et al., 2005]. Using this setting we derive the formulation describing the profile of the tumour front at low cell density parts at a single time instant:
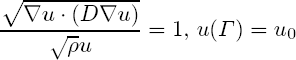
where u0 is the lowest cell density threshold for images and Γ is the last visible contour of the tumour in the image. This derivation is based on the fact that Fisher-Kolmogorov equation admits a travelling wave solution in 1D. Using this formulation, given a single image with a tumour and a set of estimated parameters (D and ρ), we are able to extrapolate the unseen parts of the tumour.
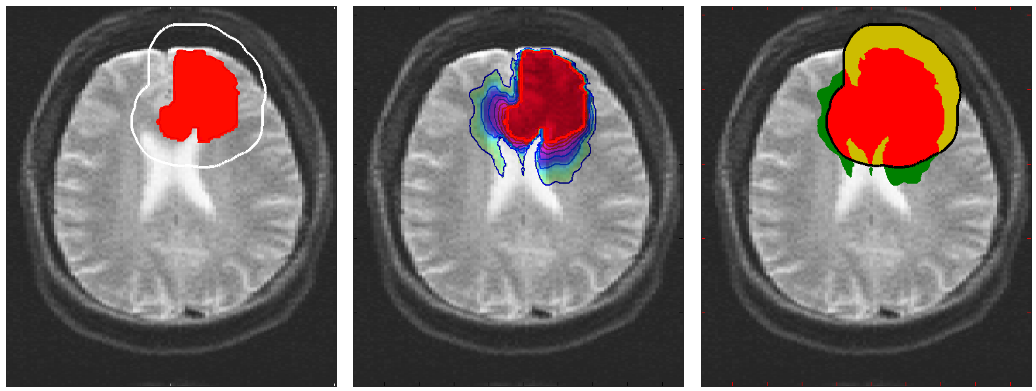
4.2 Invasion Margins
The advantage of this formulation is that it extrapolates the low density profile of the tumour using a single time instant, providing a tool for medical doctors to use in planning radiotherapy. Moreover, the formulation constructs a patient-specific tumour profile based on the underlying tissue structures and the current location of the tumour, which provides a realistic initial condition for tumour growth models in trying to predict the evolution of the tumour.
In the Fisher-Kolmogorov formulation of tumour growth, speed of growth depends mostly on the product of D and ρ, while the extent of the tumour depends on the ratio of these parameters. When we have two images of the same patient taken at different time instances, the observed evolution of the image tumour delineation may be explained by an infinite number of parameter since the same product will produce very similar evolutions of the front wave. However, the extent of the infiltration margin will be very different as it depends on the ratio of the parameters. This effect is shown in the video below.
4.3 References
- [Clatz et al., 2005] Clatz, O., Sermesant, M., Bondiau, P., Delingette, H., Warfield, S. Malandain, G., Ayache, N., 2005. Realistic simulation of the 3d growth of brain tumors in mr images coupling diffusion with biomechanical deformation. IEEE TMI, 24.
- [Giese et al., 1996] Giese, A., Kluwe, L., Laube, B., Meissner, H., Berens, M., Westphal, M., 1996. Migration of human glioma cells on myelin. Neurosurgery, 38.
- [Konukoglu et al, 2006] Konukoglu, E., Clatz, O., Bondiau, P., Delingette, H., Ayache, N., 2006. Extrapolating tumor invasion margins for physiologically determined radiotherapy regions. Proc of MICCAI'06, LNCS 4190, 2006.
- [Murray, 2002] Murray, J., 2002. Mathematical Biology. Springer-Verlag.
- [Tracqui et al., 1995] Tracqui, P., Cruywagen, G., Woodward, D., Bartoo, G., Murray J., Alvord, E., 1995. A mathematical model of glioma growth: the effect of chemotherapy on spatio-temporal growth. Cell Prol. 28.
- Swanson, K., Alvord, E., Murray, J., 2002. Virtual brain tumors (gliomas) enhance the reality of medical imaging and highlight inadequacies of current therapy. Br. J. Cancer, 86.
- Jbabdi, S., Mandonnet, E., Duffau, H., Capelle, L., Swanson, K., Pelegrini-Issac, M., Guillevin, R., Benali, H., 2005. Simulation of anisotropic growth of low-grade gliomas using diffusion tensor imaging. Mag. Reson. in Med., 54.