Computational Anatomy of the Brain
1. Computational Anatomy: Aims and Methods
1.1 Evolution and Revolutions in Anatomy
According to the dictionary, anatomy is the science that studies the structure and the relationship in space of different organs and tissues in living systems. During the antiquity and middle-ages, anatomical descriptions were mainly based on animal models and the physiology was more philosophical than scientific. Modern anatomy really began at the renaissance with the authorisation of the dissection of human cadavers, giving birth to the "De humani corporis fabrica" published by in 1543 by Vesale (1514-1564), and was strongly pushed by the progresses in surgery, as exemplified by the "Universal anatomy of the human body" (1561-62) of the great surgeon Ambroise Paré(1509-1590).
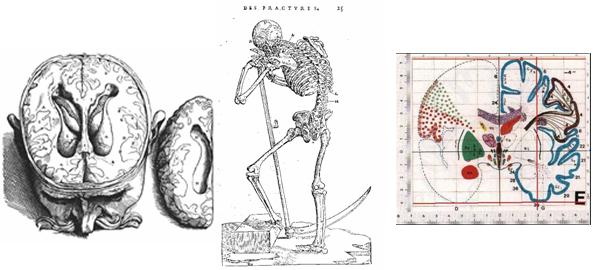
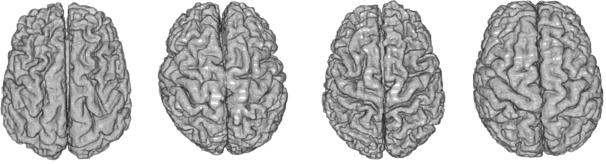
During the following centuries, many progresses were done in anatomy thanks to the introduction of new observation tools like microscopy and histology, going down to the level of cells in the 19th and 20th centuries. However, in-vivo and in-situ imaging is radically renewing the field since the 1980ies. An ever growing number of imaging modalities allows to observe both the anatomy and the function at many spatial scales (from cells to the whole body) and at multiple time scales: milliseconds (e.g. beating heart), years (growth or ageing), or even ages (evolution of species). Moreover, the non-invasive aspect allows repeating the observations on multiple subjects, giving rise to large databases. This has a strong impact on the goals of the anatomy which are changing from the description of a representative individual to the description of the structure and organisation of organs at the population level. The huge amount of information generated (typically 50 to 150 Mb for a clinical MRI exam, much more for a CT one) also raises the need for computerised methods to extract and structure information. This led in the last 10 to 20 years to the gradual evolution of descriptive atlases into interactive and generative models, allowing the simulation of new observations. Typical examples are given for the brain by the MNI 305 ([Evans et al, 1993]) and ICBM 152 ([Mazziotta et al, 2001] ) templates that are the basis of the Brain Web MRI simulation engine [Collins et al, 1998]. In the orthopaedic domain, one may cite the "bone morphing" method [Fleute and Lavallée, 1998,Rajamani et al, 2004] that allows to simulate the shape of bones.
1.2 Aims of Computational Anatomy
The combination of these new observation means and of the computerised methods is at the heart of computational anatomy, an emerging discipline at the interface of geometry, statistics and image analysis whose goal is to develop algorithms to model and analyse the biological shape of tissues and organs. The goal is not only to estimate representative organ anatomies across species, populations, diseases, ageing, ages but also to model the organ development across time (growth) and to establish their variability. Another goal is to correlate this variability information with other functional, genetic or structural information (e.g. fibre bundles extracted from diffusion tensor images). From an applicative point of view, a first objective is to understand and to model how life is functioning at the population level, for instance by classifying pathologies from structural deviations (taxonomy) and by integrating individual measures at the population level to relate anatomy and function. For instance, the goal of spatial normalisation of subjects in neuroscience is to map all the anatomies into a common reference system. A second application objective is to provide better quantitative and objective measures to detect, understand and correct dysfunctions at the individual level in order to help therapy planning (before), control (during) and follow-up (after). This generally implies mapping some generic (atlas-based) knowledge to patients-specific data through atlas-to-patient registration. Computational anatomy is currently a very active research field, as exemplified by the IPAM's Graduate Summer School on Mathematics in Brain Imaging organised by P. Thompson, M. Miller in 2004 or the workshop on the Mathematical Foundations of Computational Anatomy (MFCA'06), organised in September 2006 in conjunction with MICCAI'06, the 9th International Conference on Medical Image Computing and Computer Assisted Intervention.
1.3 Methods of Computational Anatomy
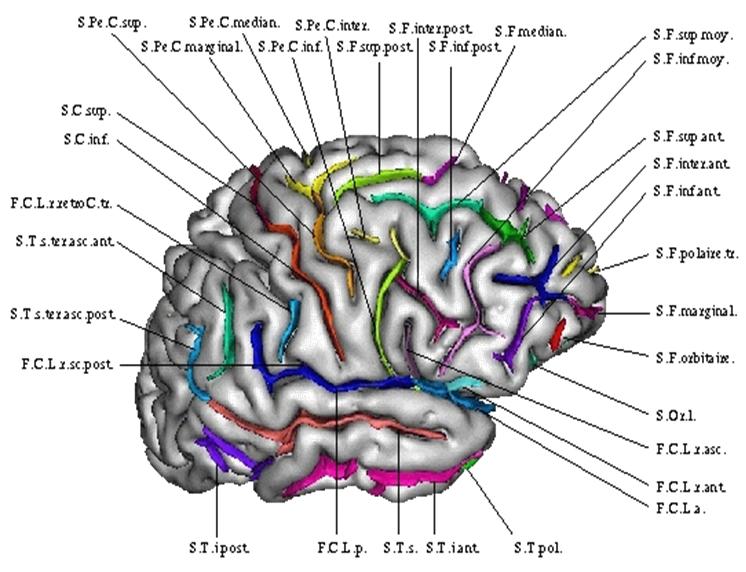
In the case of observations of the same subject, many geometrical and physically based registration methods were proposed to faithfully model and recover the deformations. However, in the case of different subjects, the absence of physical models relating the anatomies leads to a reliance on statistics to learn the geometrical relationship from many observations. The general method is to identify anatomically representative geometric features (points, tensors, curves, surfaces, volume transformations), and to model their statistical distribution across the population. This can be done, for instance, via a mean shape and covariance structure after a group-wise matching. In the case of the brain, one can rely on a hierarchy of structural models ranging from anatomical or functional landmarks like the AC and PC points ([Talairach and Tournoux, 1988; Bookstein, 1978]), curves (e.g. crest lines, sulcal lines) ([Mangin et al 2004; Le Goualher et al. 1999, Fillard et al. 2005]), surfaces like sulcal ribbons ([Thompson et al., 1997; Andrade et al., 2001; Vaillant et al., 2007]), images seen as 3D functions, which lead to voxel-based morphometry (VBM [Ashburner and Friston, 2000]), diffusion imaging or rigid, multi-affine or diffeomorphic transformations ([Trouvé 1998; Miller et al., 2002; Arsigny et al., 2006]), leading to Tensor-based morphometry (TBM).
One crucial point is that these features usually belong to curved manifolds rather than to Euclidean spaces, which precludes the use of classical linear statistics. For instance, the average of points on a sphere is located inside the sphere and not on its surface. To address this problem, one has to rely on statistical tools that work directly on Riemannian manifolds in an intrinsic way. A consistent set of such tools including the mean value, covariance matrix, Normal law, Mahalanobis distance were for instance proposed in [Pennec, 2006] along with efficient algorithms and tractable approximations for small variances. These tools were later extended to a complete algorithmic framework to compute on manifolds with the example of so-called "tensors" (symmetric positive definite matrices) [Pennec et al, 2006]. In particular, it was showed that one can perform interpolation, filtering, isotropic and anisotropic regularisation and restoration of missing data (extrapolation or in-painting) on manifold valued images by using generalised weighted means and partial derivative equations (PDEs).
1.4 Example use of Computational Anatomic Models in the Clinical Workflow
1.4.1 Better Constrain Atlas-to-Patient Registration for Radiotherapy
The planning step for conformal radiotherapy requires the accurate localisation of the tumour, to maximise its irradiation, and of the critical structures where the irradiation has to be minimises. To segment these structures for each patient, one standard method is to register a previously labelled atlas to the patient image. This allows transferring the generic atlas segmentation toward the patient-specific space. This segmentation can then be used directly, or as an initialisation for a more complex segmentation algorithm [Commowick, 2007]. In such a system, the main difficulty is to obtain an inter-subject registration algorithm which is accurate enough and, more importantly, robust to the anatomical variability and to the pathologies (tumours may be quite important).
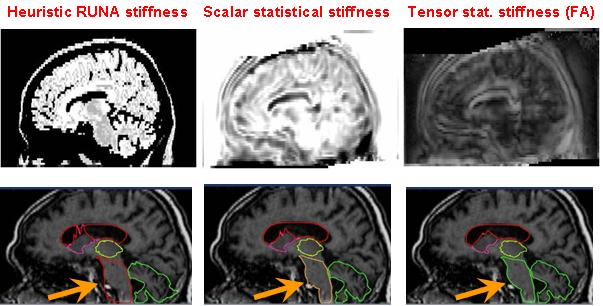
The main method to enforce meaningful deformations is to penalise non sensible ones through a regularisation criterion. Some authors used physical models like elasticity or fluid models [Bajcsy and Kovacic, 1989, Christensen et al., 1997]. For efficiency reasons, other authors proposed to use non-physical but fast regularisation methods like Gaussian filtering [Thirion, 1998, Pennec et al., 1999, Modersitzki, 2004]. However, since we do not have in general a model of the deformation of organs across subjects, no regularisation criterion is obviously more justified than the others. Thus, most of the existing work in the literature rather tries to capture the organ variability from a statistical point of view on a representative population of subjects (see e.g. [Thompson et al., 2000, Rueckert et al., 2003, Fillard et al., 2005]). For instance, following [Lester et al., 1999], the algorithm RUNA developed in [Stefanescu et al., 2004, Stefanescu, 2005] was a first attempt to obtain a computationally efficient but highly steerable nonlinear registration algorithm that includes some anatomical information about the tissue types. It uses a non-stationary transformation regularisation which is strong where the local deformability is expected to be low, and conversely. This also allows taking into account pathologies such as tumours or previous resections.
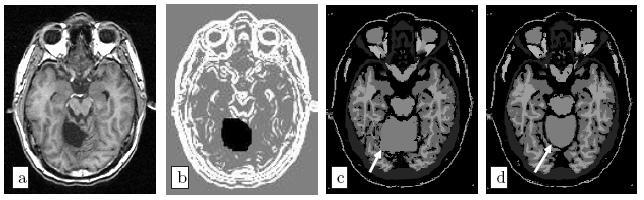
Moreover, the regularisation can be locally tuned along spatial directions through the use of a tensor field, as we did for instance in [Commowick et al., 2005], by introducing a method to compute scalar and tensor based deformability statistics over a database of patient.
1.4.2 Mapping the fibres to patient images for tumour growth models
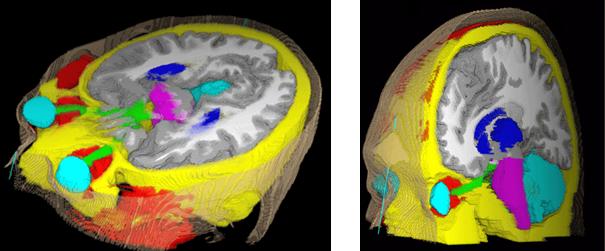
As shown in the tumour growth model section, the DTI information is crucial in the formulation of the tumour growth model because tumour cells move much faster on the white matter and they tend to follow the fibre tracts. Hence, the infiltration pattern of the tumour highly depends on the local fibre directions. Since diffusion tensor images give the average local fibre orientation they can be used to extract these tumour highways as it was done in the model we have explained to construct the diffusion tensor of tumour cells. Unfortunately, DT-MRI images are seldom acquired in the clinical routine because of technical constraints (old clinical MR scanners often do not have gradients powerful enough to acquire this sequence), time constraints which are crucial for the image quality, especially on children (a typical DTI acquisition lasts about 10 minutes during which the child should not move, which may require sedation), ethical issues and economical efficiency (there is no clinical indication for DTI yet).
Thus, in order to use local fibre directions information for patients without DTI, we have to rely on a generic atlas of fibres, i.e. register tensors from a healthy subject onto the patient anatomy.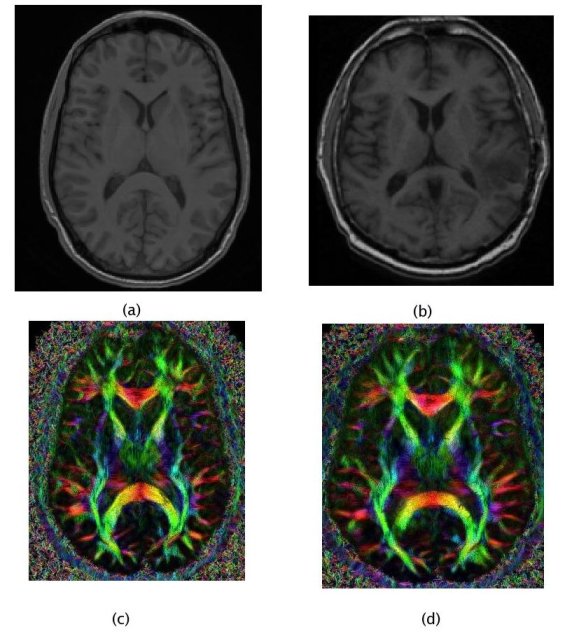
In such a personalisation process, the quality of the registration algorithm is essential as it directly affects the model and the growth simulation. Thus, using prior knowledge about the inter-subject variability is necessary to obtain a fibre mapping which is anatomically meaningful. Once again, computational anatomy appears as a key component of the clinical image analysis work-flow.
1.5 References
- [Andrade et al., 2001] Andrade A., Kherif F., Mangin J.-F, Worsley K., Paradis A.-L., Simon O., Dehaene S. and Poline J.-B.. Detection of fMRI activation using cortical surface mapping. Hum. Brain Mapp., 2001
- [Ashburner et Friston, 2000] Ashburner, J. Friston, K. J. Voxel-Based Morphometry-The Methods. NeuroImage 11(6):805-821, 2000.
- [Arsigny et al., 2006] Arsigny V., Commowick O., Pennec X., and Ayache N. A Log-Euclidean Framework for Statistics on Diffeomorphisms. In Proc. of MICCAI 2006
- [Bajcsy and Kovacic, 1989] Bajcsy R., Kovacic S., Multiresolution Elastic Matching, CVGIP, vol. 46, 1989, p . 1-21 .
- [Bondiau, 2004] Bondiau P.Y. Mise en oeuvre et évaluation d'outils de fusion d'image en radiothérapie. Thèse de sciences, Université de Nice-Sophia Antipolis, November 2004
- [Bookstein, 1978] Bookstein F.L., The Measurement of Biological Shape and Shape Change, in Lecture Notes in Biomathematics, vol. 24. New York: Springer-Verlag, 1978.
- [Collins et al, 1998] Collins D.L., Zijdenbos A.P., Kollokian V., Sled J.G., Kabani N.J., Holmes C.J., Evans A.C. Design and Construction of a Realistic Digital Brain Phantom" IEEE Transactions on Medical Imaging, vol.17, No.3, p.463--468, June 1998.
- [Christensen et al., 1997] Christensen G., Joshi S., Miller M., Volumetric transformation of brain anatomy, IEEE Trans. Med. Imag., 16, 864--877, 1997
- [Commowick 2005] Commowick O., Stefanescu R., Fillard P., Arsigny V., Ayache N., Pennec X., and Malandain G. Incorporating Statistical Measures of Anatomical Variability in Atlas-to-Subject Registration for Conformal Brain Radiotherapy. In J. Duncan and G. Gerig, editors, Proceedings of MICCAI 2005, volume 3750 of LNCS, pages 927-934, 2005. Springer Verlag
- [Commowick, 2007] Commowick O., Design and Use of Anatomical Atlases for Radiotherapy. PhD Thesis, Nice -- Sophia-Antipolis University, February 2007
- [Evans et al, 1993] Evans A. C., Collins D. L., Mills S. R., Brown E. D., Kelly R. L., Peters T. M., 3D statistical neuroanatomical models from 305 MRI volumes, Proc. IEEE-Nuclear Science Symposium and Medical Imaging Conference, 1813-1817, 1993.
- [Fillard et al, 2005] Fillard P., Arsigny V., Pennec X., Thompson P.M., and Ayache N. Extrapolation of Sparse Tensor Fields: Application to the Modeling of Brain Variability. In Gary Christensen and Milan Sonka, editors, Proc. of Information Processing in Medical Imaging 2005 (IPMI'05),2005. Springer.
- [Fillard et al, 2007] Pierre Fillard, Vincent Arsigny, Xavier Pennec, Kiralee M. Hayashi, Paul M. Thompson, and Nicholas Ayache. Measuring Brain Variability by Extrapolating Sparse Tensor Fields Measured on Sulcal Lines. Neuroimage, 34(2):639-650, January 2007. Note: Also as INRIA Research Report 5887, April 2006. PMID: 17113311.
- [Fleute and Lavallée, 1998] Fleute, M. and Lavallée S. Building a Complete Surface Model from Sparse Data Using Statistical Shape Models: Application to Computer Assisted Knee Surgery. Proc. of Medical Image Computing and Computer-Assisted Interventation (MICCAI'98), LNCS Vol. 1496, p.879-??, 1998.
- [Le Goualher et al. 1999] Le Goualher G., Procyk E., Collins L., Venegopal R., Barillot C., Evans A, Automated extraction and variability analysis of sulcal neuroanatomy. IEEE Transactions on Medical Imaging, 1999
- [Lester, 1999] Lester, H., Arridge, S.R., Jansons, K.M., Lemieux, L., Hajnal J.V. and Oatridge, A. Non-linear Registration with the Variable Viscosity Fluid Algorithm. Proc of IPMI'99, LNCS 1613, p.238-251, 1999.
- [Mangin et al., 2004] Mangin J.-F., Riviere D., Cachia A., Duchesnay E., Cointepas Y., Papadopoulos-Orfanos D., Collins D., Evans A., and Regis J. Object-based morphometry of the cerebral cortex. IEEE Transactions on Medical 23(8) 23:968-982, 2004. Imaging.
- [Mazziotta et al, 2001] Mazziotta J, Toga A, Evans A, Fox P, Lancaster J, Zilles K, Woods R, Paus T, Simpson G, Pike B, Holmes C, Collins L, Thompson P, MacDonald D, Iacoboni M, Schormann T, Amunts K, Palomero-Gallagher N, Geyer S, Parsons L, Narr K, Kabani N, Le Goualher G, Boomsma D, Cannon T, Kawashima R, Mazoyer B. 2001. A probabilistic atlas and reference system for the human brain: International Consortium for Brain Mapping (ICBM). Philos Trans R Soc Lond B Biol Sci 356:1293--1322.
- [Miller et al., 2002] Miller M., Trouvé A., Younes L., On the Metrics and Euler-Lagrange Equations of Computational Anatomy, Annual Review of biomedical Engineering, 2002
- [Modersitzki, 2004] Modersitzki J., Numerical Methods for Image Registration, Oxford University Press Series: Numerical Mathematics and Scientific Computation, 2004
- [Pennec et al, 1999] Xavier Pennec, Pascal Cachier, and Nicholas Ayache. Understanding the ``Demon's Algorithm'': 3D Non-Rigid registration by Gradient Descent. In C. Taylor and A. Colchester, editors, Proc. MICCAI'99, volume 1679 of LNCS, Cambridge, UK, pages 597-605, September 1999. Springer Verlag.
- [Pennec, 2006] Pennec X. Intrinsic Statistics on Riemannian Manifolds: Basic Tools for Geometric Measurements. Journal of Mathematical Imaging and Vision, 25(1):127-154, July 2006.
- [Pennec et al, 2006] Pennec X., Fillard P. and Ayache N., A Riemannian Framework for Tensor Computing. International Journal of Computer Vision, 66(1):41-66, January 2006
- [Rajamani et al, 2004] Rajamani, K.T. Joshi, S.C. Styner, M.A. Bone model morphing for enhanced surgical visualization. In Proc of IEEE Symp. on Biomedical Imaging: Nano to Macro (ISBI) 2004, Vol. 2, p.1255-1258, April 2004.
- [Rueckert et al, 2003] Rueckert D., Frangi A.F., Schnabel J.A., Automatic construction of 3-D statistical deformation models of the brain using nonrigid registration, IEEE Transactions on Medical Imaging 22,p. 1014- 1025, 2003
- [Stefanescu, 2004] Radu Stefanescu, Xavier Pennec, and Nicholas Ayache. Grid Powered Nonlinear Image Registration with Locally Adaptive Regularization. Medical Image Analysis, 8(3):325-342, September 2004. PMID: 15450226.
- [Stefanescu et al, 2005] Stefanescu R., Pennec X., and Ayache N. A Grid Service for the Interactive Use of a Parallel Non-Rigid Registration Algorithm of Medical Images. Methods of Information in Medicine, 44(2), 2005.
- [Talairach and Tournoux, 1988] Talairach J., Tournoux P. Co-Planar Stereotaxic Atlas of the Human Brain: 3-dimensional Proportional System : an Approach to Cerebral Imaging". Thieme Medical Publishers, New York, 1988.
- [Thirion, 1998] Thirion J.P. Image matching as a diffusion process: An analogy with maxwell's demon. Medical Imag. Analysis, 2:243--260, 1998.
- [Thompson et al., 1997] Thompson P.M., MacDonald D., Mega M.S., Holmes C.J., Evans A.C., Toga A.W., Detection and Mapping of Abnormal Brain Structure with a Probabilistic Atlas of Cortical Surfaces, Journal of Computer Assisted Tomography 1997
- [Thompson et al., 2000] Thompson, P., Mega, M., Narr, K., Sowell, E., Blanton, R., and Toga, A. (2000). Brain image analysis and atlas construction. Handbook of Medical Image Proc. and Analysis, chapter 17. SPIE.
- [Trouvé 1998] Trouvé A., Diffeomorphisms Groups and Pattern Matching in Image Analysis, Int. J. Computer Vision, 1998
- [Vaillant et al., 2007] Vaillant M., Qiu A., Glaunès J., Miller M., Diffeomorphic metric surface mapping in subregion of the superior temporal gyrus, NeuroImage, 2007