Summary
- Clinical Introduction
- Task Objectives
- Data Collection
- Multi-modal Image Registration [UPDATED]
- Volume Estimation [UPDATED]
- Erosion Assessment [UPDATED]
- References [UPDATED]
Clinical Introduction
Juvenile Idiopathic Arthritis (JIA) is a very heterogeneous condition combining different forms of chronic arthritis of unknown origin. The onset of JIA ranges from several months after the birth to the age of 16, while the peak age is approximately at 6 years. JIA primarily affects the synovia and the bones of the joints; moreover chronic synovial inflammations may cause progressive joint destruction and serious functional disabilities. The impact of JIA on our society is significant, since it affects approximately one in 1000 children, and represents the major cause of acquired disability in paediatric population.
The causes of JIA have not been yet identified insofar that, in most cases, JIA is still a diagnosis of exclusion. Even if arthritis is not directly inherited, it seems very likely that both genetic and environmental factors are important for the manifestation of the disease. Hence, many efforts have been produced in the last few years in order to understand better the causes of the disease and, consequently, to introduce more effective (drug) treatments. More specifically, one major issue of interest is the possibility of distinguishing/classifying among different levels of the disease, and thus the ability of developing more specific and appropriate treatments for each subtype of patients. However, no statistically significant results have been obtained so far, and current classification - which is based on clinical criteria - is still unsatisfactory: many of the proposed subgroups don't appear homogeneous enough. It is still not possible, for instance, to distinguish effectively, early in the disease course, patients who are most likely to develop joint damage (and who therefore require a more aggressive treatment at an early stage) from those who are having a mild disease course. Finally, in clinical trials, drug efficacy may be judged only on clinical parameters, since physicians still lack quantitative measures that can allow for an early identification of both the progression of joint damage and the drug efficacy on disease progression.
From the considerations above, one can easily understand how important it is to identify reliable indicators of JIA activity, which can provide us with quantitative information about the disease. Actually, such goal is the main motivation of the research work outlined in this report, in which we exploit information contained in radiological images and we try to integrate it with clinical data.
Several imaging techniques have been tested on their ability to visualise and quantify both synovitis and erosions. Our hypothesis is that automatic analysis of the acquired images can lead to the desired quantitative indicators. However, not all the imaging modalities can be conveniently used for this purpose. In fact, for example, X-rays can show bone erosion, cartilage loss (indirectly, through joint space narrowing), and joint misalignment, but can not visualise synovia, joint effusion, articular cartilage, bone marrow, or ligaments and tendons directly. Thus, X-ray scoring methods can allow for joint damage evaluation in JIA, but are insensitive to synovitis.
Magnetic resonance imaging (MRI) is able to image synovitis and bone oedema/inflammation as well as damage to cartilage and bone, and it can detect erosive changes with greater sensitivity than radiography, particularly in early stages of the disease. MRI is also capable of detecting tendon pathology and evaluating ligament integrity.
Musculoskeletal ultrasound (MSUS) has been shown to be superior to clinical examination in the diagnosis and localisation of joint effusion, bursal fluid collection and synovitis. A number of studies have described improved sensitivity for detection of bone erosions in joints with the use of ultrasound as compared with conventional plain radiography. It is the imaging modality of choice for the diagnosis of tendon pathology. Ligament, muscle, peripheral nerve and cartilage pathology can also be readily investigated by MSUS. It allows a quick, safe and inexpensive access to otherwise undetectable anatomical information on the early targets of most rheumatic diseases.
MSUS and MRI are, therefore, potential powerful imaging tools to assess joint inflammation and the progression of joint damage. However, to date, little information exists on the use of these image techniques in JIA and standardised, validated, and feasible assessment systems are lacking.
The value of MRI, as an advanced method to evaluate disease activity and disease damage in adults with rheumatoid arthritis, is under active investigation by a research consortium called Outcome Measures in Rheumatology Clinical Trials (OMERACT). However, the results that will be drawn from OMERACT studies are not directly applicable to children, because adult rheumatoid arthritis is different from JIA and because the growing skeleton of children needs a different approach. Indeed, in children ossification is incomplete and joint space width varies with age.
UpTask Objectives
Data analysis in the scope of JIA pathology has two main objectives: 1) the identification of meaningful features that can be extracted from medical data, and consequently 2) the modelling of joint damage for an early diagnosis and assessment of the disease. As already pointed out above, our two main sources of information are clinical data and images. More specifically, the hypotheses we want to investigate is that a first set of feature can be extracted directly from radiological images of the joints, since we believe these are the most "characterising" feature (i.e. they discriminate better among patients). In a second stage of the classification process, image-based features can be integrated with those extracted from clinical data, in order to obtain a statistically grounded model of the disease.
Even if both image modalities, MR and MSUS, have shown to be very sensitive to early changes in the joints, our focus is only on the first modality, which appears better suited for quantitative measurements and for standardisation of the protocol. Henceforth, we assume MRI are the input images of our algorithms, and all the following discussions and assumptions apply specifically to this imaging modality.
From the wide literature on rheumatoid arthritis, we extracted the following set of features that have been reported to be effective in quantitative assessment of arthritis activity and damage.
- inflamed synovial membrane;
- bone erosion.
Therefore, from an algorithmic point of view, our main objective is to design, implement and validate algorithms to 1) (semi-)automatically extract and 2) quantitatively measure the above features from MR images.
The measurement of the synovial membrane volume is of particular interest. Indeed, such volume has been shown to be an early predictor for joint damage in adult patients affected by rheumatoid-arthritis (Østergaard et al., 1999) and osteoarthritis (Farrant et al., 2007), and it is expected to be valid also for JIA. The detection of bone erosions is important as well, since in MRIs, as opposed to conventional radiography, it can be successfully performed also in the early stages of the disease. Therefore both features, synovial volume and bone erosions, are important in modelling the disease course.
From a technical point of view, measurement of the synovial membrane volume completely depends on its segmentation. Working with 3D MRIs with no gap or overlap between the slices, as it is our case, the segmentation of the synovia from the other tissues allows the estimation of its volume by counting the number of detected voxels. The actual volume is given by the number of voxels times the volume of a single voxel. The quality of the estimate will depend on two factors: the accuracy of the segmentation, and the entity of the partial volume effect.
In the case of bone erosions we are interested in their detection, rather than in a quantitative estimate of their volume. However, the problem is in many respect similar to the segmentation of the synovial membrane, since it involves the classification of voxels or patches as belonging to an erosion or not. Differences will be in the features used to describe the voxels/patches, and possibly in the exploitation of methods to detect the bones contours (where the erosions are necessarily located).
Once one is equipped with the results of the two segmentation algorithms, it is possible to combine them in order to gain the confidence in the corresponding measurements. As it will be discussed in detail in the section about the data collection, for each enrolled patient there are MRI data at different modalities and different times (baseline and follow-up). Therefore, in order to combine the results, we also need to register the input images of the same patient.
To summarise, the achievement of our (clinical) goals implies the solution of the following (algorithmic) Computer Vision problems:
- synovial membrane segmentation in contrast-enhanced MRIs;
- detection of bone erosion in T1 pre-contrast MRIs;
- registration of intra-patient images at different times and different modalities.
In the following subsections we provide brief overviews of related works for each of the technical objectives.
Estimation of the Synovial Membrane Volume
The segmentation of the synovial membrane has often been performed manually by human operators (Østergaard et al., 1999; Farrant et al., 2007). However such approach is extremely time-consuming, and furthermore the reliability of the results can suffer from intra- and inter-observer variability. Even if it is widely acknowledged that automatic segmentation can be advantageous in terms of both time and consistency of the results, relatively few works propose automatic methods for the segmentation of the synovial membrane, especially for the sites of our interest, hips and wrist.
The automatic segmentation problem can be approached from two different directions: either by looking for the contours/surfaces of the regions in 2D/3D image (i.e. by contour-based segmentation), or by labelling directly the pixels/voxels (i.e. by pixel-based segmentation). By surveying the tiny state-of-the-art works on the segmentation of the synovial membrane, the pixel-based approach results the leading one. Surprisingly enough, so far the focus has been only on the simplest pixel-based segmentation method: the thresholding in its various forms. In global thresholding the intensity range of the images is split into intervals and each pixel is labelled according to the interval its intensity belongs to. A comparison of segmentation of the synovial membrane by thresholding with manual annotation is reported in (Østergaard, 1997). This technique is obviously too basic, and necessarily is highly sensitive to noise and artifacts in the images, inhomogeneities in the magnetic fields. Moreover if one looks at the value of a single pixel alone, the spatial coherence between neighbouring pixels cannot be taken into account. Another widespread segmentation method in medical image analysis is fuzzy c-means clustering, and it has been recently applied to the segmentation of the synovia in the wrist (Tripoliti et al., 2007).
For completeness, we now report some recent works on the segmentation of the cartilage, because this problem shares some affinities with our. (Folkesson et al., 2005a) and (Folkesson et al., 2005b) segment the cartilage in MR knee scans, with the aim of quantifying the progression of osteoarthritis. The proposed methods are both based on the combination of Approximate Nearest Neighbour (ANN) classifiers; an ANN is similar to a plain k-Nearest-Neighbour classifier, but it looks for an approximate solution in order to reduce the computational cost. The method presented in (Grau et al., 2004) has also been applied to knee cartilage. It extends the popular watershed segmentation algorithm by introducing prior knowledge obtained by estimating the posterior probabilities of the classes under study assuming a Potts' model, a generalisation of Ising model for two classes. (Warfield et al., 2000) presented a semi-automatic segmentation method, applicable to a wide range of tissues (among them also cartilage), iterating between a classification step and a template registration step. At the classification step each voxel is assigned to the class most represented by its first k neighbours in the aligned template (which has been previously segmented). The intermediate classification result is then used to refine the non-rigid registration. (Tang et al., 2004) applied a modified version of the gradient vector flow (GVF) snakes to the segmentation of ankle cartilage. In (Solloway et al., 1997) the active shape model is applied, unmodified, to the segmentation of femoral cartilage.
Detection of Bone Erosions
In order to detect bone erosions, two different approaches have been proposed so far. First, since it seems plausible to consider the erosions as “lesions” (or abnormalities) connected to bone boundaries, a two step procedure can be adopted in which the entire bone volume is pre-segmented, and then the abnormalities are searched along the boundaries of the segmented volume. The alternative approach aims to detect directly the regions in the images where bone lesions are most likely to occur. The first approach has drawn more attention than the second one. Indeed, most of the previous works focused on finding the contours of the bones in plain images (i.e. each MR slice separately). However, they share the disadvantage that the performance of the detection is dependent on the accuracy of the delineation of the contours. In order to increase such accuracy - and, thus, to reduce the risk of misclassification - the algorithms usually rely on human initialisation and intervention.
On the other side, a direct detection of erosions necessarily requires both a formal definition of what an erosion is - i.e. how it looks like in an MR image - and some assumptions about where it can happen; otherwise the number of false detections can make the performance of the system fall down. This is because the local appearance of bone erosions is indistinguishable from many other artifacts that do lie within the wrist area. As for the other approach, the human contribution may improve significantly the performances of the system.
Therefore, if one aims at comparing and evaluating different methods for bone erosion detection, one important aspect that must be taken into account is the degree of autonomy, which refers to the need for human intervention either before or during the running of the algorithms. Intuitively, the physicians might be asked to assist the algorithm only rarely and if no other options are available. In fact, human intervention is shown to be critical when physicians are required to manually segment image regions, due to the great variability of their responses. Indeed, it is still matter of debate how to combine different manual segmentations performed by either the same physician several times or two or more physicians. Bias can be introduced if this step is not performed carefully. Given all these caveats, we strongly believe that human intervention should be avoided almost completely. Therefore, later in this report we will propose a method to overcome this problem, by making the segmentation process more complicated but, at the same time, more robust.
The following is a more detailed discussion of some of the most popular algorithms that have been used so far to detect bone erosions.
Let's consider first the methods based on active contours [Kass et al. 1988]. In a nutshell, active contours look for a 2D curve minimising an energy made up of two terms: an internal energy which accounts for the elasticity and smoothness of the curve, and an external energy which accounts for the image features (for instance the edges extracted by Gaussian gradient filtering). Note that although the solution is highly dependent on the model initialisation, the method might be made more robust by adopting a coarse-to-fine strategy.
This general approach has been applied, with minor modifications, to the segmentation of bones in both radiographies and MRIs. The former is the case of the work described in [De Luis-Garcia et al. 2003], where the authors require an accurate segmentation of the finger bones in order to estimate the skeletal age of the patient. Their method modify the general approach in two ways: first, they exploit domain knowledge to initially place the snakes on the phalanges and metacarpal bones; second, the external energy is the sum of the image gradient and of an energy which favours the expansion of the contour (introduced in [Cohen 1999], to make the method more robust to initialisation). Active contours have been applied to bone MRIs in [Snel et al. 1998], who looked for the planar contours of the carpal bones in the MRI slices. Inspired by the work described in [Lobregt et al. 1995], they use only the normal component (with respect to the contour) of the external energy, which avoids the problem of clustering the pixels of the curve (henceforth called snaxel), which affecting the original method. Moreover, in order to overcome the problems due to the varying image contrast along the contour, they also normalise the external energy with a local contrast level estimated in the neighbourhood of each snaxel. In both works, the snake can be refined or snaxels fused together depending on the distances between each of them.
Active contour methods do not use any prior knowledge on the shapes of the contours. Hence a more sophisticated class of methods has been introduced, called Active Shape Models (ASM), which try to exploit any prior information available for the specific problem, by analysing the mode of variations of a set of representative examples (the so-called training set). In the Medical Imaging context, ASMs have been already applied to the segmentation of vertebrae in Dual Energy X-ray Absorptiometry (DXA) images [Smyth et al. 1997] to overcome the problem posed by the low signal-to-noise ratio and poor spatial resolution of DXA with respect to standard radiographies. The authors claim an accuracy comparable with that of human operators. In [Behiels et al. 2002], an assessment is presented, on 400 images of different bone structures, of the performance of three different methods: a standard ASM method, a probabilistic method based on Maximum-a-Posteriori criterion [Wang et al. 1998] and an extension of ASM. This third method is essentially based on the introduction of a regularisation term in the fitting problem, which is then solved by minimal cost path (MCP) search.
Registration of multi-modality MR images
As we made it clear above, the results obtained separately by the two segmentation algorithms (synovial membrane and bone erosions) would improve if one was able to compare (spatially) the locations of the segmented regions. In fact, inflammation of synovia seems to be caused by specific neurotransmitters released from inside the bones in the regions where an erosion occurred. However, since our aim is to combine statistically meaningful (quantitative) features extracted from heterogeneous data sources (clinical and images), it is possible that the advantages of working on registered images, rather than on the measures extracted from unregistered images, can be quite limited. In fact, other clinical factors could carry similar information insofar that information related to the registration would result in more redundancy of the dataset. Therefore, so far we considered the registration of multi-modality MR images more as an exploratory tool than as an essential component of our statistical decision system.
The actual work we have done so far focuses on surveying the scientific literature on multi-modality registration of medical images. A complete report on the state-of-the-art works is still in preparation and will be available in next documents of the project.
UpData Collection
Planned Data Acquisitions
The Health-e-Child study is designed as cross-sectional and prospective, with an expected patient sample of 300 JIA patients (100 in each of the 3 participating centres). Patients with JIA (according to ILAR classification) and with active arthritis in the wrist and/or hip are enrolled in the study. For enrolled patients, MRI and US of the wrist and/or hip are performed at study entry (baseline), and then at one and, when possible, two years of follow-up. MRI of the wrist is performed only in cooperating patients that do not require general anaesthesia.
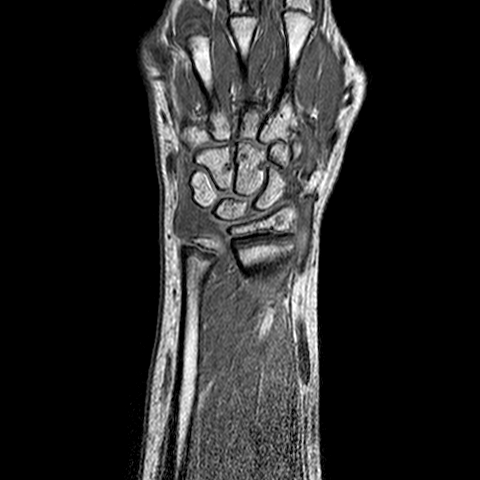
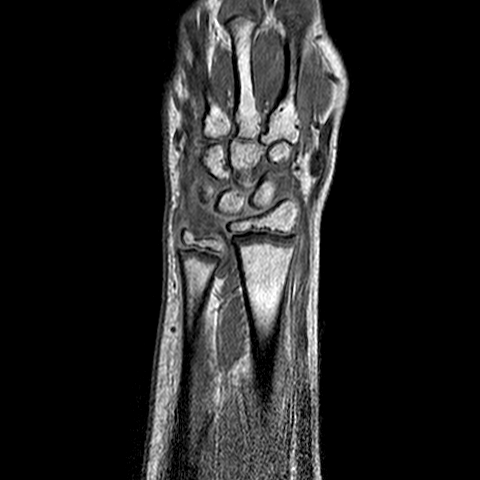
The images are acquired with the protocol developed in the first year of the project, consisting of:
- volumetric, fast field echo T1
- volumetric, fast field echo T1, with fat suppression, 1.5 min after injection of Gd-DTPA
- turbo spin echo T2, with fat suppression
- volumetric, fast field echo T1, with fat suppression, 10 min after injection of Gd-DTPA
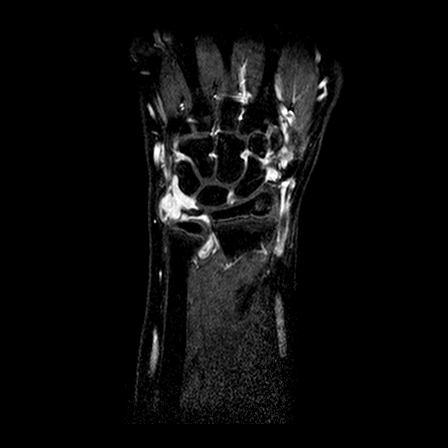
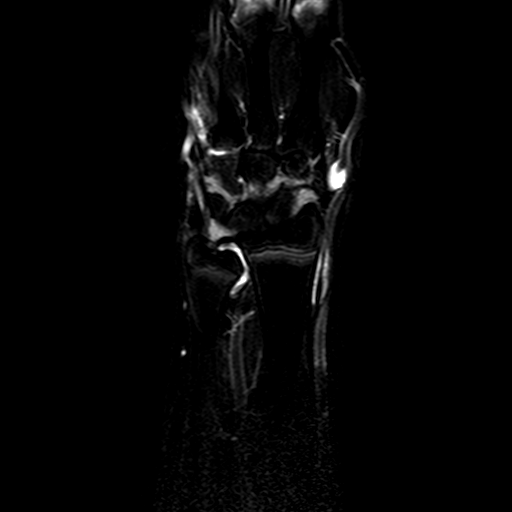
| y=-70 | y=-65 | y=-60 | |
| T1 pre-contrast | 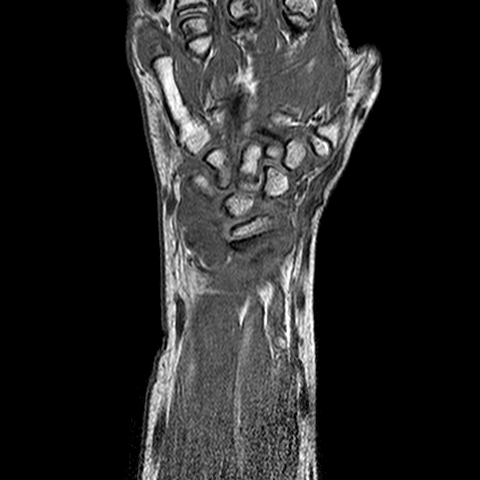 |
 |
 |
| T1 after 1.5 min | 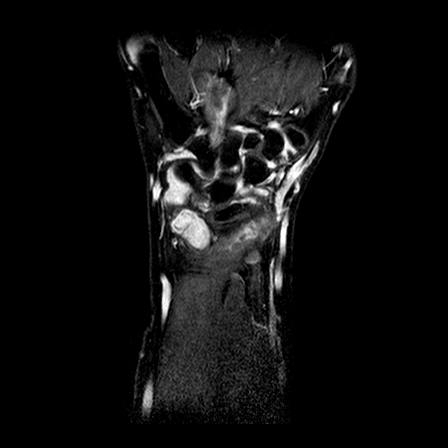 |
 |
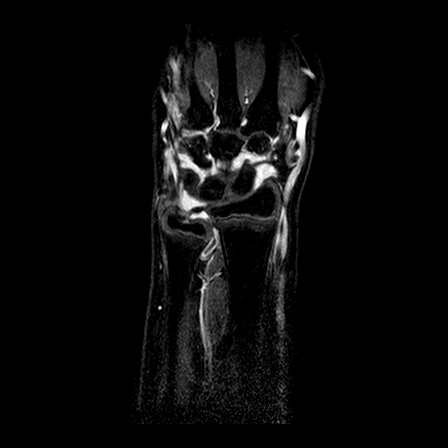 |
| T2 | 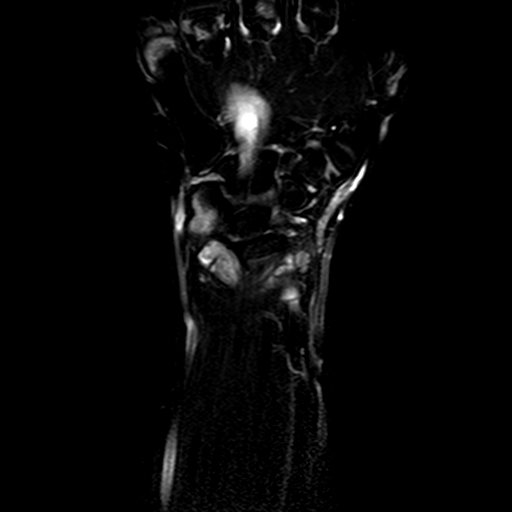 |
 |
|
| T1 after 10 min | 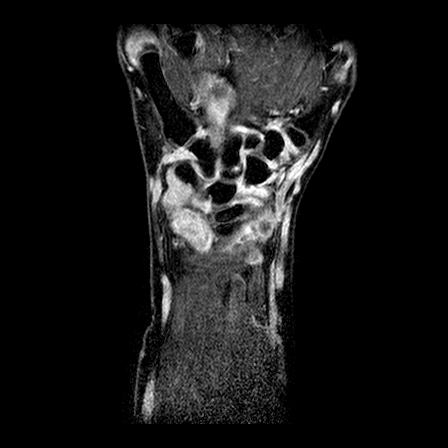 |
 |
 |
As explained in the section about the task objectives, the results of the image analysis will be integrated with other data in order to provide a model of the disease course. In this early stage of the research work, we are mostly interested in integration with clinical parameters (including standardised measures of disease activity and disease damage), routine laboratory data (including ESR, CRP, WBC and differential count, RBC, Hb, PTL, ANA, RF), and semi-quantitative scores for damage evaluation in XR, US and MR.
Data Annotations
Our approach to image analysis is based on machine learning; more specifically we design our algorithms in the setting of learning by example. Therefore, we need annotated examples, highlighting the structures of interest, in order to perform training, validation and testing of the methods we develop. Namely, we need a manual segmentation of the synovial membrane for the volume estimation and of the bone erosion for erosion detection. As we will see in short, the former annotations must be particularly accurate in order to obtain an accurate estimation of the volume. For the annotation task we developed a software tool described in the deliverable for WP12.
| y=-70 | y=-65 | y=-60 | |
| Operator 1 | 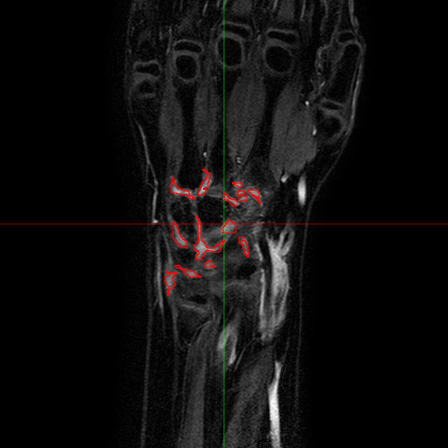 |
 |
 |
| Operator 2 | 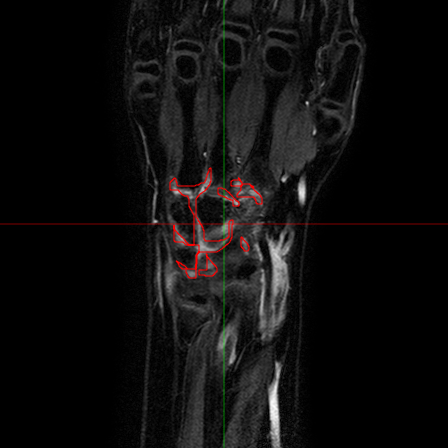 |
 |
 |
The analysis of the manual annotations performed on the same exams by two clinicians provides useful indications on the complexity of the problem. First, we can compare the annotations on a per-slice basis. If we compare the synovial membrane volume resulting from the annotations, we can observe that: 1) they are highly correlated, with r=0.92 and p<0.001, but 2) there is an average absolute difference of 30.5%. The latter measurement is mitigated when we look at the median absolute difference, which is 14.4%, but the fact remains that the volumes estimated from different observers shows a variability. This variability does not disappear considering whole exams: some of the differences tend to balance, and the absolute average difference drops to 15.2%, but the median absolute difference decreases only to 12.1%. Also interesting is the comparison between annotations from a classification point of view. If we look at the voxels which have been classified by both observers as belonging to the synovial membrane, these make up 63% (on average) of the voxels marked as synovia by either of them. That is, around one third of the voxels classified by one observer as synovia, are classified by another one as NOT synovia.
This results, although partially due to operator errors, are also the product of an inherently difficult problem. The structures to be segmented are extremely thin structures (see Fig.2), and often can be discriminated only on the basis of anatomical knowledge rather than signal intensity. As a result of the thin shape of the structures, small pixel-wise errors on their boundaries might produce significant errors on the volume. This can be verified by subjecting the manual annotations to binary dilation and erosion, and comparing the resulting volumes with the original ones. In both cases there is a absolute change of over 30%.
The analysis of the manual annotations, briefly summarised above, points out the complexity of the problem of accurately estimating the synovial membrane volume. It also sets out what might be a reasonable goal for the performance of an automatic method, which of course cannot beat the examples it is trained with.
UpMulti-modal Image Registration
Both clinical objectives of synovial volume estimation and bone erosion detection would benefit from the preliminary registration of the multi-modal MR images included in each study. In particular, we face three types of registration problems:
- intra-patient, intra-study registration
- intra-patient, inter-study registration (between baseline and followup studies)
- inter-patient registration
The first problem is the simple registration of all modalities in a single MR study. This problem can be approached as a rigid registration problem, and its solution is needed in order to be capable of fully exploit all information provided by the different modalities. Indeed, this type of registration allows to locate the image voxels corresponding to the same physical point across modalities. The second problem occurs when considering pairs of baseline and follow-up studies. In this case it would be helpful to be able to find the voxels corresponding to the same anatomical point, in order to perform visual or automatic comparison of image features indicating, eg. bone erosions. This problem is considerably more difficult than the previous one, since the natural growth together with the pathological processes produce deformations between the two studies which cannot be modeled as rigid. Finally, addressing the third problem would provide a standard frame of reference for all studies, which could potentially allow the exploitation of information about the voxels position both in synovia segmentation and in erosion detection. Moreover, a non-rigid inter-patient registration could allow for the use of an anatomical prior defined on a reference atlas, thereby improving the robustness of the segmentation.
All problems have been addressed. We employ a registration algorithm based on the maximization of the mutual information, as published in Mattes et al, 2003. The implementation is based on the open source library ITK (see http://www.itk.org). Note that although technically in the second and third problems the modalities are the same, in practice we found that maximizing the mutual information provides an efficient way to be robust with respect to the changes in image intensities and anatomy naturally occurring in this case. We show below some representative examples of the results obtained on our data for the intra-study registration and the inter-patient registration (only the rigid part). It can be readily seen that the three modalities are perfectly aligned. The inter-patient alignment also worked well, keeping in mind that pure rigid registration cannot compensate for the differences inherent to the different anatomies between patients.
| modality #1 | modality #2 | modality #3 | |
| Exam #1 | 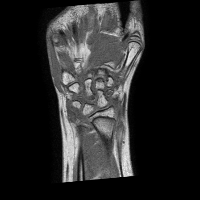 |
 |
 |
| Exam #2 | 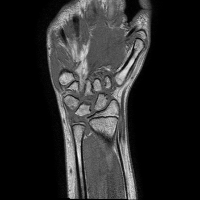 |
 |
 |
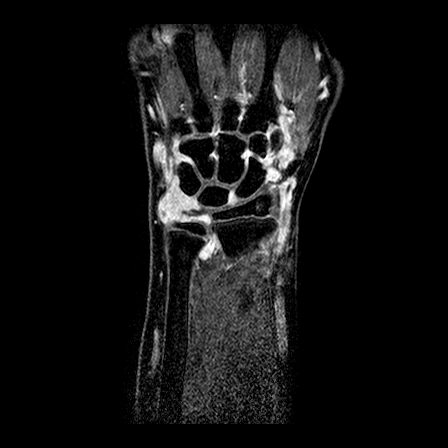
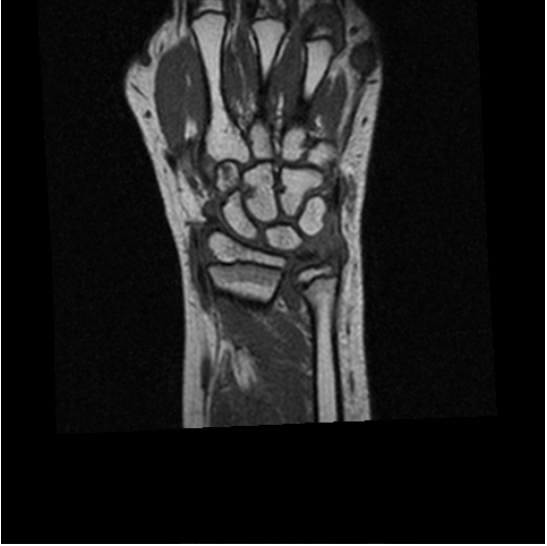
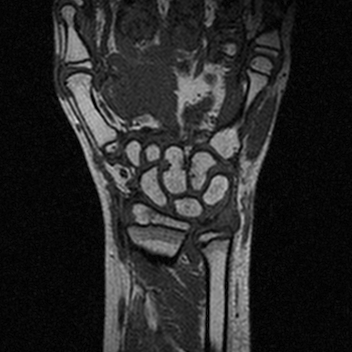
In the examples above only the a rigid transformation has been used. To address the problem of inter-study registration, in particular having in mind the application to the assessment of erosion progression, a non-rigid component is also required. The same registration method cited above, through the maximimization of mutual information, proved extremely effective. We show below two representative examples of registration between baseline and follow-up studies of the same patient, as well as between studies of different patients.
| study #1 (fixed) | study #2 (registered) | study #2 (original) | |
| inter-study | 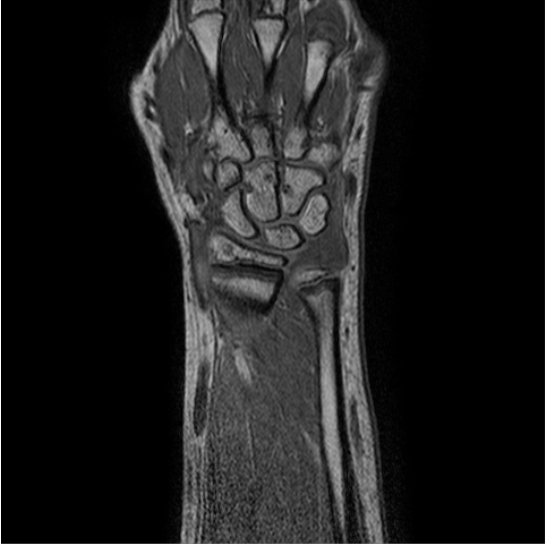 |
 |
 |
| inter-patient | 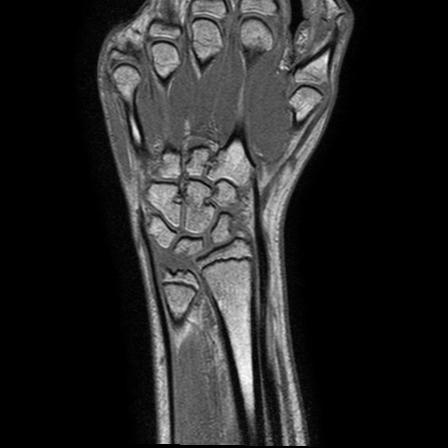 |
 |
 |
We remark that, depending on the application, we use the deformation field estimated during the registration process, rather than the image warped with such field. This will be seen more in detail in the section about erosions.
UpVolume Estimation
The accurate estimation of the volume of the inflamed synovial membrane is the first objective of our work. From an algorithmic point of view, such objective can be achieved by first segmenting inflamed synovia from all others tissues, and then evaluating the volume of the segmented regions. The conversion between the volume in voxels of the segmented regions and their actual volume in cubic mm can be conveniently done by means of MR volumetric acquisitions. To this aim, the clinical partners designed a protocol for MRI acquisitions, including series of T1-weighted, volumetric MR images, of the hips or wrists of the enrolled patients. Two of the series are acquired 1.5 and 10 minutes after the injection of a Gd-DTPA bolus, which enhances the contrast of highly vascularized tissues, as it should occur in case of an active synovial pannus.
As we have seen in the previous section, the manual segmentation of the enhanced parts is, at least in the wrist, a tedious and time-consuming, and the results have an high inter-operator variability. These are serious hurdles to the use of the synovial volume as a predictive marker for the future erosive damage. Therefore, any automatic or semi-automatic measurement method would be welcome, provided it could reduce both the variability and the time required for the measure. However, one should not overlook the difficulties in designing such a method. These are due to the thin shapes under study (high sensitivity of the result to errors in the segmentation), and to the necessity of incorporate some prior anatomical knowledge (for discriminating between synovia and other enhanced structures).
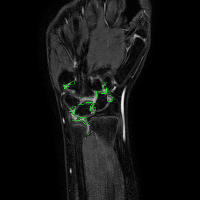
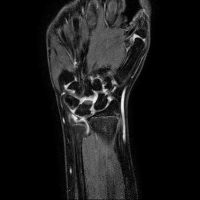
We approach the problem as one of classification. Previously, we approached the problem in two stages. On a basic level, we wanted to classify the voxels as belonging to enhanced structures or not. Note that at this stage we were not yet interested in the discrimination between actual synovial membrane and other enhanced structures. At a second stage, however, once the enhanced voxels had been classified/segmented, we wanted to classify each group of connected voxels as belonging to the synovial membrane or not. This approach has been now superseded. Both levels of classification (enhanced vs. not enhanced, inflamed synovia vs. other enhanced structures) are addressed by a single classifier.
The classifier is obtained by training a discriminative function, represented by a linear combination of features selected from a large data-dependent dictionary. The training step is performed by solving a regularised least-square problem, while the feature selection is currently performed via Orthogonal Matching Pursuit (OMP, see Davis et al, 1997).
The performance of the classifiers and of the volume estimation is tested in a cross-validation fashion. We iteratively put aside one or more annotated exams and train/validate the classifiers on the remaining data; the obtained classifiers are then tested on the untainted exams.
Further details can be found in [Basso et al, 2009a], [Basso et al, 2009b] and [Basso et al, 2010].
| Patient #1 | 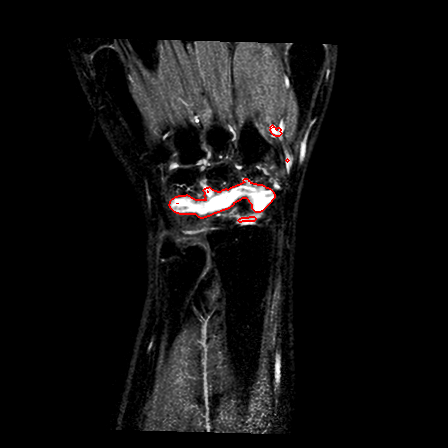 |
 |
 |
| Patient #2 (baseline) | 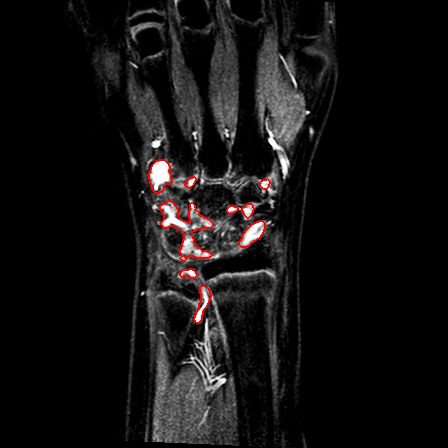 |
 |
 |
| Patient #2 (follow-up) | 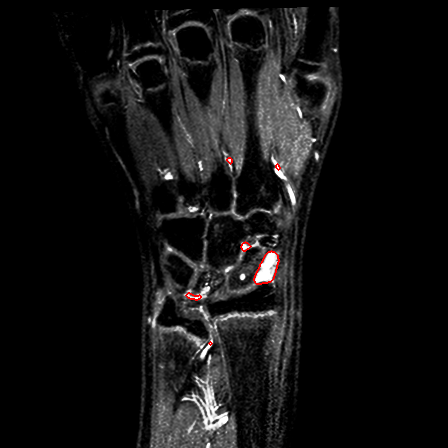 |
 |
 |
Previous studies estimated for the volume estimation a precision of 0.025 cc (computed per slice, over the cross-validation loops). For comparison, a human observer compared with a second one would achieve a precision of 0.017 cc. In order to evaluate the usability of the system in a clinical setting, preliminary to validation, we computed its agreement with respect to the volume computed by a clinician. The system achieves an ICC rate of 0.85 (95% CI: 0.83-0.87), compared to the agreement between two human observers of 0.94 (95% CI: 0.92-0.95). This two results are excellent, especially since they have been obtained from a completely automatic system, without human intervention.
Further cross-sectional and longitudinal studies confirmed the viability of the synovial volume normalized by the body surface (NSV), as an imaging biomarker for assessing the disease activity and in studying its progression. A significant difference in the values of the NSV, from 3.48 to 1.79 (p<0.0005), has been found between baseline and follow-up, with a standardized response mean (SRM) of 1.04. A strong and significant correlation is present between the radiographic damage progression in patients undergoing DMARD therapy and the volume at baseline (r=--0.82, p<0.02). The cross-sectional analysis of 58 studies showed significantly different values of the NSV in patients grouped according to: low/high score pain (2.26/3.92, p<0.0002), low/high score swelling (2.45/4.28, p<0.0005), low/high score limitation of motion (LOM, 2.42/3.61, p<0.01), as well as polyarticular/non-polyarticular JIA subtype (2.33/3.30, p<0.02). Moreover, the NSV correlates (r=0.39, p<0.005) with a semi-quantitative score of synovitis based on the adult OMERACT score, which assesses both the thickness of the synovial membrane and its hyper-intensity. The NSV presents also moderate/weak significant correlations with all the clinical indicators of disease activity that the OMERACT synovitis score correlates with: the physician score on a visual analog scale (r=0.42, p<0.002), the number of joints with limitation of motion (r=0.37, p<0.005), the number of swollen joints (r=0.36, p<0.01), the composite score JADAS71 (r=0.35, p<0.01), the white blood cells count (r=0.35, p<0.01).
UpErosion Assessment
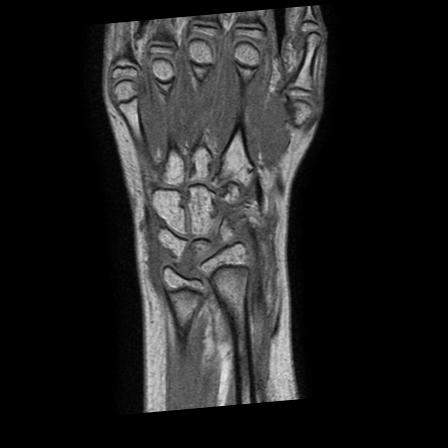
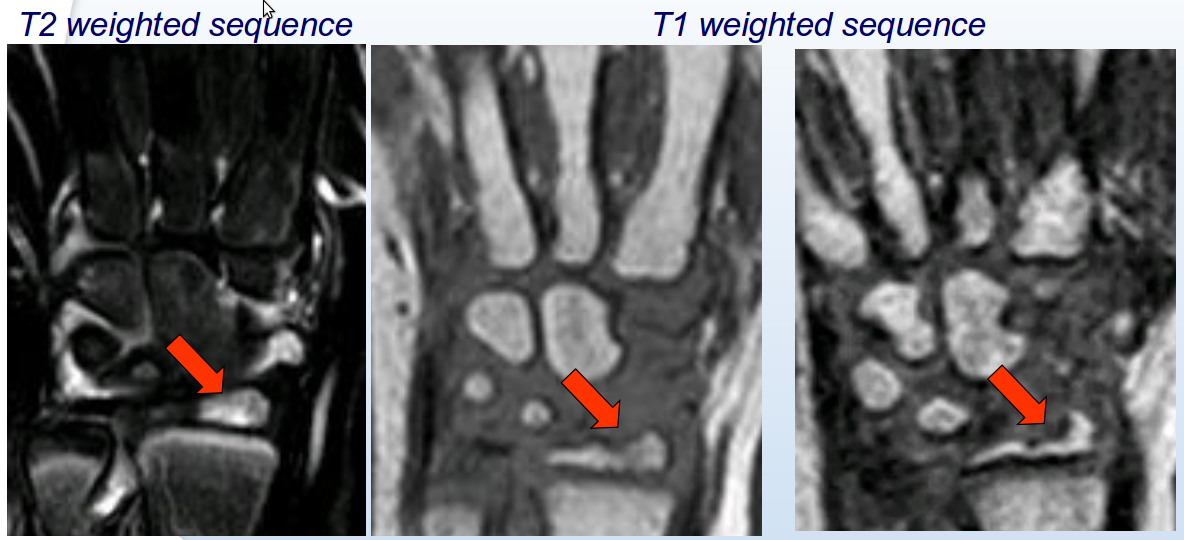
As anticipated above, bone erosions play a fundamental role in the analysis and quantification of JIA progression. Specifically, an accurate quantification of temporal changes of erosions between baseline and followup studies may be used to discriminate the actual outcome of specific drug treatments or therapies.
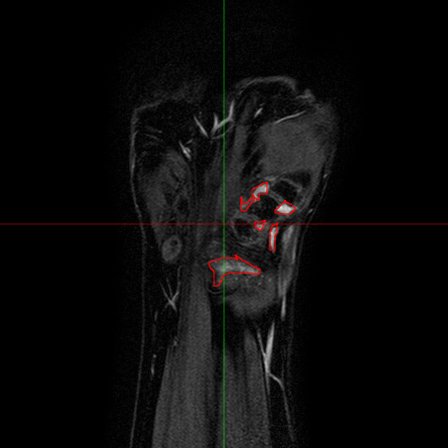
From a radiological viewpoint, an erosion may be defined as a bony depression visible in at least 2 planes on 3DT1 sequences. However, this basic definition may be equivocal, and usually radiologists need additional findings suggestive of inflammation in order to assess correctly the bone damage. Examples of such further findings are the presence of surrounding bone edema, effusion and enhancement in the corresponding areas on T2 sequences or the presence of irregularities on X-ray examinations). Most of such findings require an high-level analysis and the combined visual inspection of different examinations, which are very difficult to replicate using a computerized system. Nonetheless, despite being considered more achievable, also the manual analysis has shown to be affected by a large variability when performed by different physicians.
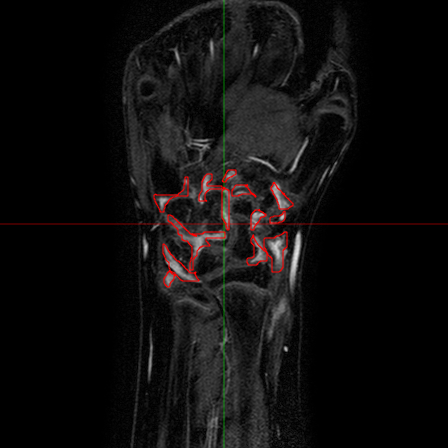
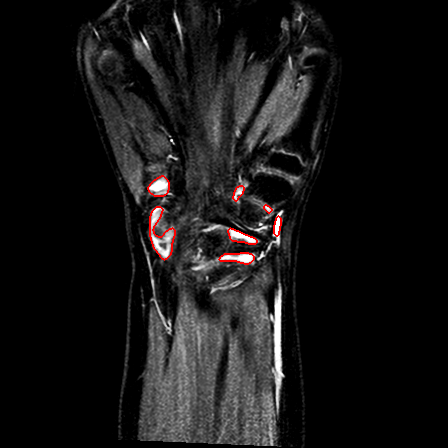
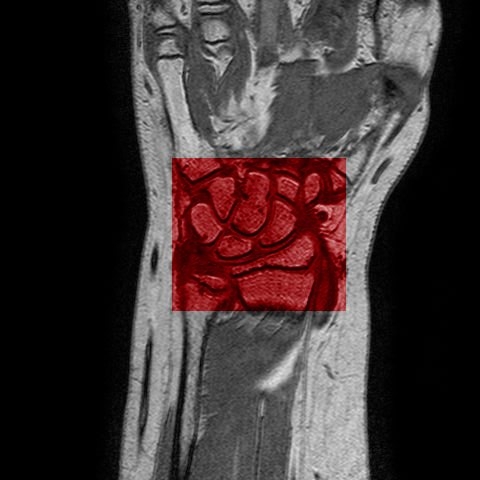
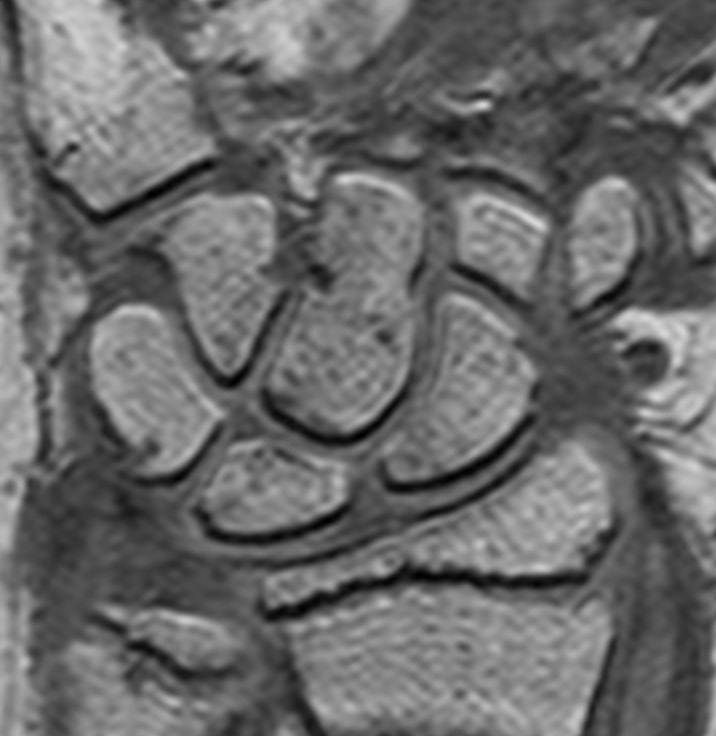
Fig.6 - An T1 pre-contrast image of a wrist (left). The red
square represents the region of interest for the bone erosion
modules, and is magnified on the right.
In collaboration with the physicians involved in the project, we considered the problem of defining a suitable and reliable scoring system for MR studies. It is worth emphasizing here that the main goal of this part of our work was to assist the physicians to improve the current diagnostic analysis of JIA patients. Therefore, the starting point has been the evaluation of the existing scoring system based on a semi-quantitative index ranging from 0 to 4, that shows a good reliability. However, the limited number of possible values makes the index poorly sensitive to changes, especially in children.
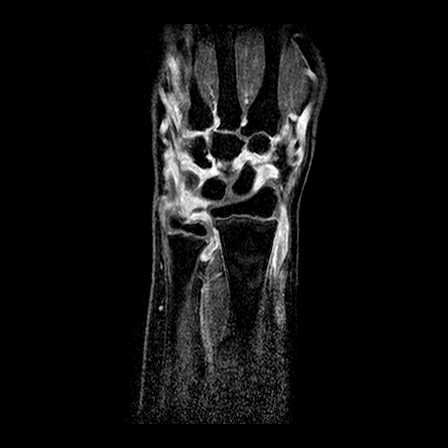
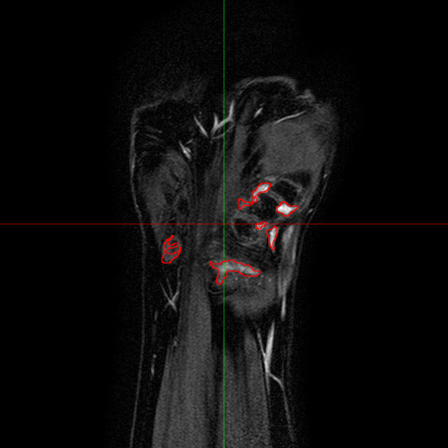
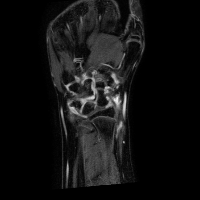
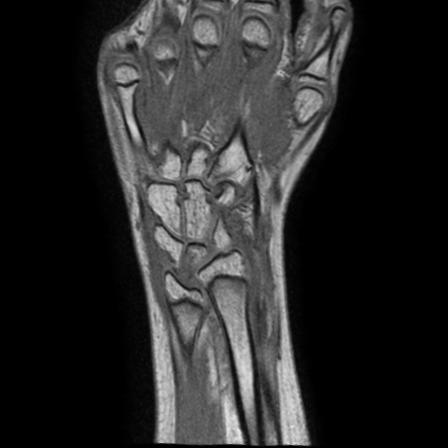
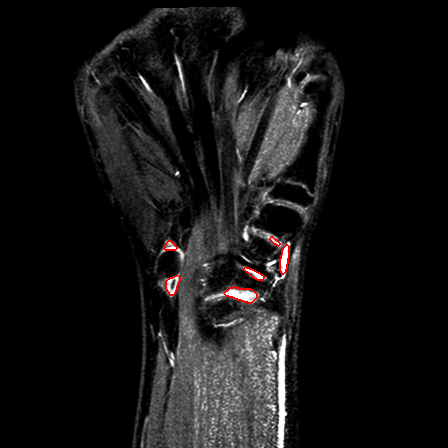
Fig.7 - Progression of the erosion after one year. The
first two images (on the left) represent the baseline
examination. The third image (on the right) show the
followup.
The first result obtained within this part of the project was to propose a new score from 0 (normal) to 10 (the whole bone eroded). Of course, such score requires a more accurate analysis since the increased number of classes may lead to a poor reliability. The automation of the analysis in this context is therefore essential. In the last months of the project, within WP11, our work focused on designing, implementing and testing algorithms for the assessment of the new score and its monitoring over time. Specifically, we first developed a software suite quiped with an intuitive graphical interface enabling the physicians to exploit the results of the registration for a semi-quantitative evaluation of erosion progression. Thereafter, we worked on automating such evaluation by leveraging on the annotations collected by the physicians. The first part of our work comprised two distinct modules: one was related to the registration of baseline-followup pairs of images acquired on the same patient, while the other consisted in developing a user interface starting from the definition of suitable use cases taking into account the requirements of the physicians.
A considerable amount of our work has been done to adapt and exploit the results of task T11.3.3. Details about the registration part are discussed above. The accuracy of the overall system (both during the manual and the automatic analysis) strongly depends on the results of the registration. Indeed, by using the registered images (instead of the original baseline-followup pairs) we observed an increase in the reliability of the new scoring method.
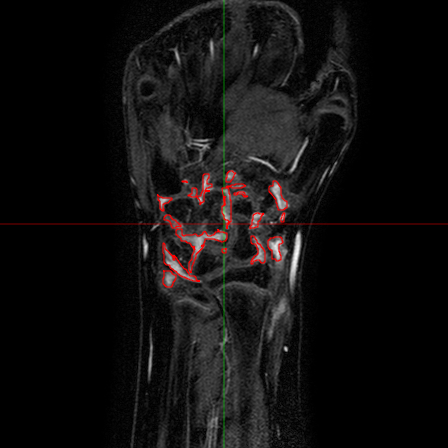
Once we registered the baseline-followup images of all the patients, the second important step was to develop a system by which the radiologists may exploit the registration results. It is well known that the non-rigid registration modifies the anatomy of the tissues and, specifically in the case of bones, it may prevent a correct evaluation of morphological abnormalities. Having this problem in mind, we decided to introduce a navigation module in our system to allow the user to move from a baseline to the corresponding followup 3D study by simply pointing on a specific voxel. The following figure represents a screen-shot of the designed GUI.
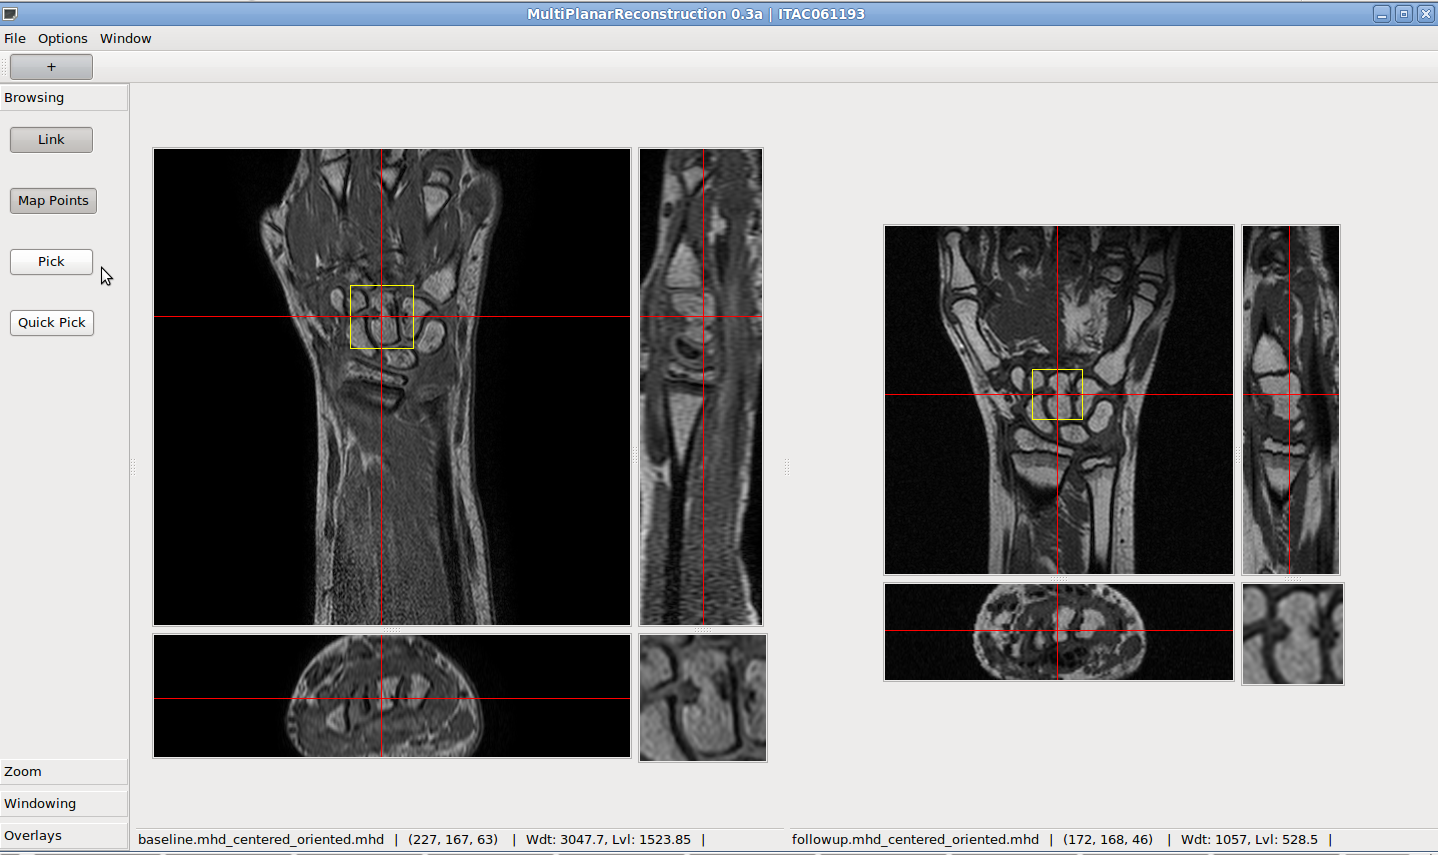
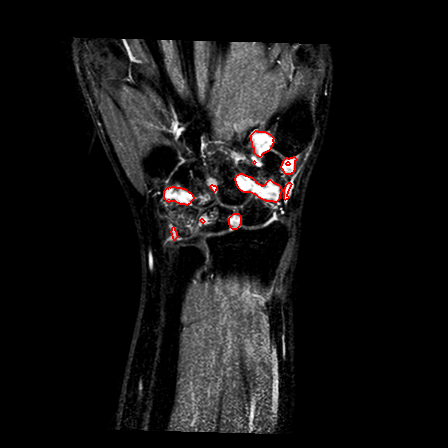
Fig.8 - A screen-shot of the GUI used for the annotation of
MR images of wrists in order to collect positive and negative
examples for the classification module.
When a user clicks on a voxel (e.g. one corresponding to a suspect erosion) on the baseline 3D image (the leftmost image panel in the GUI) the system automatically updates the panel on the right to display the corresponding slide in the followup image. Furthermore there will show up a small panel displaying a zoomed neighborhood of the selected pixel in both baseline and followup images. Such visualization scheme is useful because it exploit the results of the registration without modifying the structures of interest in the image.
After an initial stage of testing by the clinicians, the tool has been improved by allowing the users to annotate the exam directly through the graphical interface. This led to a reduction of the time needed for fully annotating a single pair of exams. Furthermore, this gave us the opportunity of collecting data for the subsequent tasks, i.e. the further automation of the analysis.
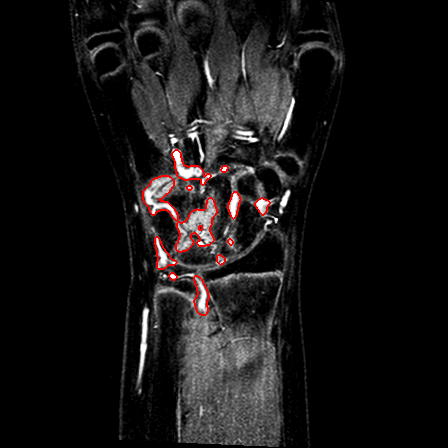
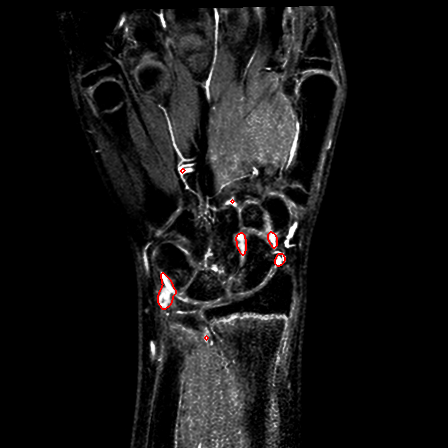
In order to accomplish the automatic analysis of the bone erosions using machine learning techniques, one needs to collect a large training set of both positive and negative annotated examples highlighting the structures of interest. In the context of JIA, annotated examples may be voxels in the 3D MR volumes of T1 pre-contrast wrists. Positive voxels are those in the neighborhood of an erosion while all the others in the volume are negatives. For collecting the training examples we implemented some slight modifications to the software in order to save the annotations during the ordinary analysis. Despite the ease of saving the annotations, the size of the training set is not large because the number of patient enrolled in the clinical study was limited.
Our approach to the automatic analysis of erosion is based on a two stage schema, in which we first identify some coarse regions of interest (connected the contours of bones) in the MR sequence and then detects those group of voxels that are likely to represent an erosion. The first segmentation is required to reduce the number of false positives and to reduce the computation time of the whole algorithm by discarding part of the (very unlikely) candidate erosions.
In order to accomplish the classification step, we decided to adopt the same learning method designed for the synovia, and the feature extraction algorithms have been used to discover the optimal set of cues and features for this specific task. The set of higher-level features are based on the following cues:
- Intensities of the voxel and the set of its first neighbors.
- Position of the voxel in millimeters, relative to the center of the acquisition volume.
- Multiscale 2-jets, computed by convolution with the appropriate derivative of a Gaussian kernel.
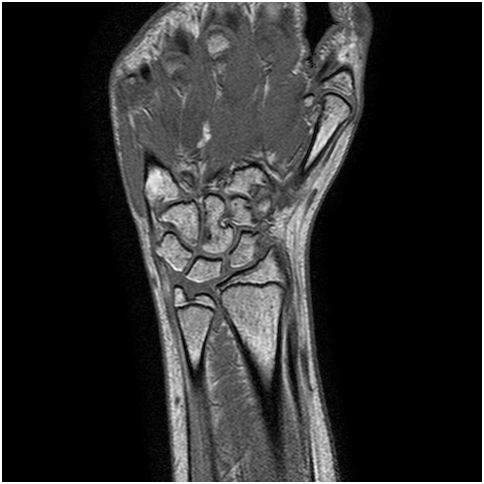
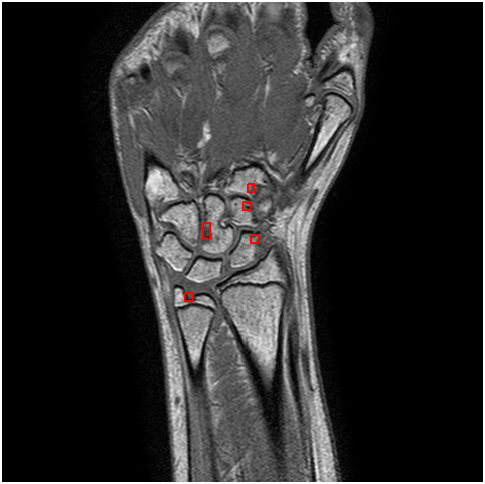
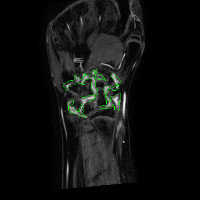
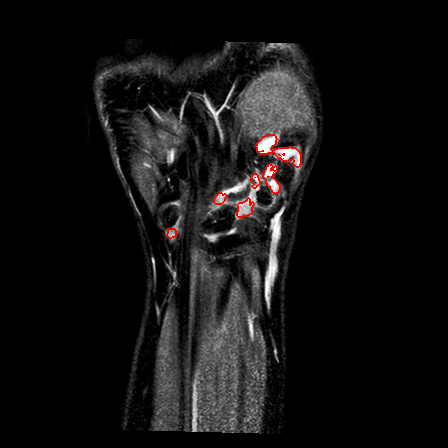
Fig.9 - An example of a slice with annotated erosions.
References
- C. Basso et al, 2009a. Segmentation of Inflamed Synovia in Multi-Modal MRI. In Proc. of IEEE ISBI 2009, June 28 - July 1 2009.
- C. Basso et al, 2009b. Automatic Annotation of 3D Multi-Modal MR Images on a Desktop Grid. MICCAI-Grid Workshop, held at MICCAI 2009, 20-24 September 2009, London, UK.
- C. Basso et al, 2010. Automatic estimation of inflamed synovial membrane volume in 3D MR images. Poster at ECR 2010 Scientific Exhibit, 4-8 March 2010, Vienna, Austria.
- C. M. Bishop, 2006. Pattern recognition and machine learning. Springer Series on Information Science and Statistics. Springer, New York, NY, USA.
- Davis et al., 1997. Adaptive greedy approximations. Constr Approx, 13(1):57-98.
- J. Farrant et al., 2007. Advanced imaging in rheumatoid arthritis. part 1: Synovitis. Skeletal Radiology, 36(4):269–279.
- J. Folkesson et al., 2005a. Combining Binary Classifiers for Automatic Cartilage Segmentation in Knee MRI. Proc. CVBIA 2005, LNCS 3765, pp. 230-239.
- J. Folkesson et al., 2005b. Automatic segmentation of the articular cartilage in knee MRI using a hierarchical multi-class classification scheme. Proc. MICCAI 2005, pp. 327-334.
- V. Grau et al., 2004. Improved watershed transform for medical image segmentation using prior information. IEEE Trans. Medical Imaging, 23(4):447-458.
- L. Lo Gerfo et al., 2007. Spectral algorithms for supervised learning. Submitted to Neural Computation. Preprint available from rosasco@disi.unige.it
- Mattes et al., 2003. PET-CT image registration in the chest using free-form deformations. IEEE Trans. Med. Imaging, 22(1):120-128.
- M. Østergaard, 1997. Different approaches to synovial membrane volume determination by magnetic resonance imaging: manual versus automated segmentation. British Journal of Rheumatology, 36(11):1166-1177.
- M. Østergaard et al., 1999. Magnetic resonance imaging-determined synovial membrane volume as a marker of disease activity and a predictor of progressive joint destruction in the wrists of patients with rheumatoid arthritis. Arthritis & Rheumatism, 42(5):918–929.
- S. Solloway et al., 1997. The use of active shape models for making thickness measurements of articular cartilage from MR images. Magnetic Resonance in Medicine, 37(6):943-952.
- J. Tang et al., 2004. Ankle cartilage surface segmentation using directional gradient vector flow snakes. Proc. of ICIP'04, pp. 2745-2748.
- J.P. Thirion, 1998. Image matching as a diffusion process: an analogy with Maxwell's demons. Medical Image Analysis, 2(3):243-60.
- E. E. Tripoliti et al., 2007. Automated segmentation and quantification of inflammatory tissue of the hand in rheumatoid arthritis patients using magnetic resonance imaging data. Artificial Intelligence in Medicine, 40:65-85.
- S. K. Warfield et al., 2000. Adaptive, template moderated, spatially varying statistical classification. Med. Image Anal., 4(1):43-55.